

Revenue attribution maps closed-won revenue back to the marketing and sales touchpoints that influenced it, giving you a financial view of channel performance that clicks and leads alone can never provide. Treat it as a decision framework for budget allocation and testing, not as a perfect accounting of cause and effect. Before you trust any model output, run a 90-day UTM and CRM association audit, or align a single conversion taxonomy across Marketing, Sales, and Finance. Those two steps fix more attribution problems than any software upgrade. Swyftinteractive builds that foundation for ecommerce brands every day, and the rest of this guide walks you through exactly how.
Table of Contents
- How revenue attribution differs from conversion tracking and ROI
- Why revenue attribution matters for B2B and ecommerce teams
- Attribution models explained: single-touch, multi-touch, and data-driven
- How to calculate attributed revenue: formulas and a worked example
- Practical best practices and common pitfalls in attribution implementation
- How to get started with revenue attribution: a step-by-step checklist
- What tools do you need for revenue attribution?
- A Swyftinteractive attribution pilot: what the work actually looks like
- Key Takeaways
- Why attribution is a lever, not a trophy
- Swyftinteractive’s attribution and ecommerce growth services
- Useful sources and further reading
- FAQ
How revenue attribution differs from conversion tracking and ROI
These three terms get used interchangeably in Slack threads and board decks, but they measure fundamentally different things.
Conversion tracking counts actions: a form fill, an add-to-cart, a demo request. It tells you what happened, not what it was worth. ROI compares total revenue to total spend, which is useful for finance but too blunt for channel-level decisions. Revenue attribution sits between them. It assigns a dollar value to each touchpoint across the full customer journey, so you can see which channels and campaigns contributed to closed deals, not just which ones generated activity.

| Dimension | Conversion tracking | ROI | Revenue attribution |
|---|---|---|---|
| Data input | Clicks, form fills, page events | Total spend vs. total revenue | CRM deal value + touchpoint sequence |
| Outcome measured | Action volume | Profit ratio | Revenue credit per touchpoint |
| Primary audience | Marketing | Finance | Marketing + RevOps |
| Best use case | Campaign optimization | Budget justification | Channel mix and resource allocation |
Consider a single paid search campaign. Conversion tracking shows 120 demo requests. A simple ROI calculation shows the campaign returned 3x spend. Revenue attribution, using a W-shaped model, might reveal that paid search earned first-touch credit on 40% of closed deals but almost no mid-funnel credit, meaning organic content and email sequences were doing the heavy lifting between awareness and close. That distinction changes how you allocate next quarter’s budget.
A key structural issue: attribution data often conflicts with CRM revenue because the two systems use different conversion definitions, timing windows, and deal-close logic. Fixing that mismatch is a prerequisite, not an afterthought.
Why revenue attribution matters for B2B and ecommerce teams
The business case for attribution comes down to one question: are you spending money on channels that actually close deals, or on channels that look good in a dashboard?
Core benefits, with the metric each one moves:
- Budget defense. Attribution gives you revenue-linked evidence for every channel, replacing gut-feel justifications with closed-deal data. Metric: ROAS by channel.
- Channel mix optimization. You can reallocate spend from channels that generate clicks but not revenue to channels that show up consistently in closed-won journeys. Metric: pipeline contribution rate.
- CAC and LTV by channel. When you tie acquisition cost to the specific channels that sourced a customer, you can calculate true customer acquisition cost per channel and compare it against lifetime value. Metric: CAC/LTV ratio.
- Content that accelerates deals. Attribution reveals which blog posts, case studies, or email sequences appear in journeys that close faster. High-growth teams use this to shorten sales cycles and reduce pipeline stall. Metric: average days to close.
- Sales-marketing alignment. When both teams look at the same revenue-linked data, disagreements about lead quality shift to shared conversations about pipeline velocity. Metric: marketing-sourced pipeline percentage.
The B2B and ecommerce contexts pull in different directions. B2B deals involve multiple stakeholders, long sales cycles, and a buying journey where 70%–73% of activity happens before a lead identifies themselves, making dark-funnel bias a serious problem. Ecommerce deals are high-volume and short-cycle, so the challenge is less about identity resolution across months and more about correctly attributing across paid, email, and organic in a 7–30 day window. The models you choose and the windows you set should reflect that difference.
Pro Tip: For ecommerce, lifecycle email flows like abandoned cart and post-purchase sequences are often under-credited in last-touch models. Run a linear or time-decay model alongside last-touch to see how much revenue those flows actually influence.

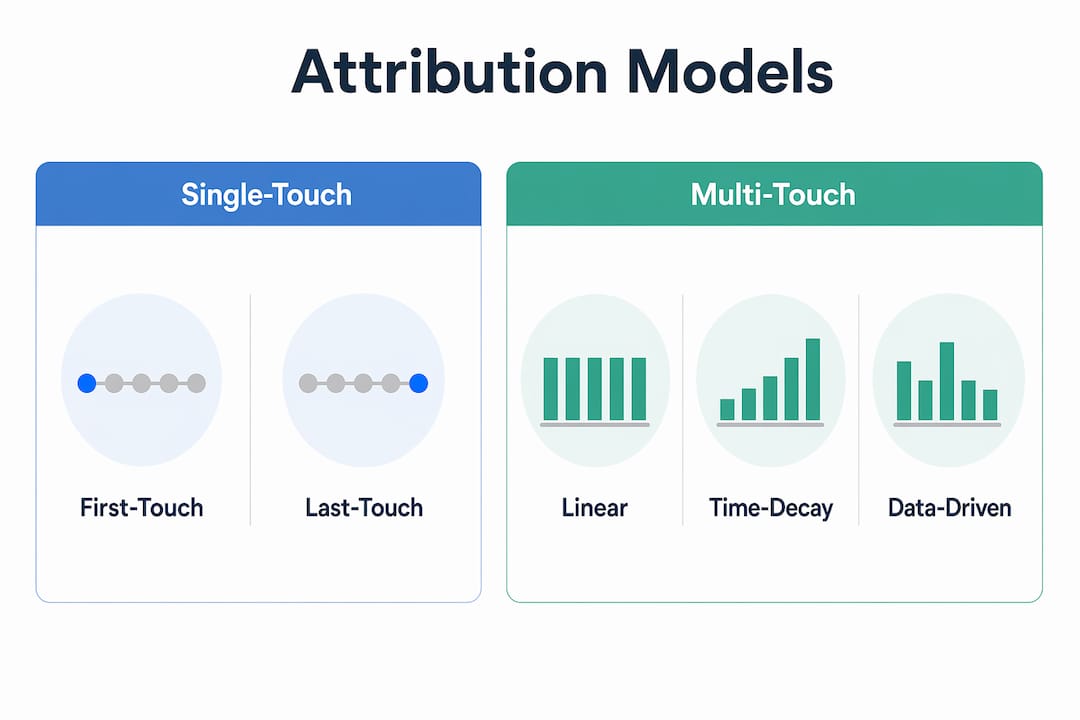
Attribution models explained: single-touch, multi-touch, and data-driven
Every attribution model is a set of rules for distributing revenue credit across touchpoints. None of them is objectively correct. The right model depends on your sales cycle, data quality, and the decision you are trying to make.
Single-touch models
First-touch attribution gives 100% of the deal’s revenue to the first recorded interaction. On a $10,000 deal, the paid ad that introduced the prospect gets the full $10,000.
- Pros: Simple to implement, great for measuring top-of-funnel channel reach.
- Cons: Ignores everything that happened between awareness and close.
- When to use it: Early-stage companies mapping which channels generate net-new awareness; week-to-week top-of-funnel reporting.
Last-touch attribution gives 100% of credit to the final touchpoint before conversion. On that same $10,000 deal, a branded search click gets all the credit.
- Pros: Easy to track, aligns with most CRM default settings.
- Cons: Systematically over-credits branded search and direct traffic, which are often the last step in a journey that started somewhere else.
- When to use it: Simple, short-cycle ecommerce purchases where the path from awareness to buy is genuinely one or two steps.
Multi-touch rule-based models
Linear attribution splits credit equally across all touchpoints. On a $10,000 deal with four touches, each gets $2,500.
- Pros: Acknowledges every interaction; easy to explain to stakeholders.
- Cons: Treats a quick email open the same as a 45-minute product demo.
Time-decay attribution weights credit toward touchpoints closer to conversion. The demo call two days before close gets more credit than the blog post six weeks earlier.
- Pros: Reflects the intuition that recent interactions matter more.
- Cons: Systematically undervalues top-of-funnel content that generates awareness.
U-shaped (position-based) attribution gives 40% to first touch, 40% to the touchpoint that converted the lead, and splits the remaining 20% across middle interactions.
- Pros: Balances acquisition and conversion credit; popular in B2B demand gen.
- Cons: Middle-funnel nurture content is still undervalued.
W-shaped attribution adds a third anchor: 30% to first touch, 30% to lead creation, 30% to opportunity creation, and 10% distributed across the rest.
- Pros: Better for B2B with distinct pipeline stages.
- Cons: Requires clean CRM stage data to work correctly.
Data-driven (algorithmic) attribution
Data-driven attribution learns from your actual conversion patterns and assigns weights based on which touchpoints statistically correlate with closed deals. Google’s data-driven model in GA4 is the most widely used example.
- Pros: More accurate than rule-based models when data volume is sufficient.
- Cons: Requires significant conversion volume and clean CRM-to-touchpoint linking to produce meaningful weights. It is also a black box, which makes it hard to explain to stakeholders.
- When to use it: Ecommerce brands with hundreds of monthly conversions and clean UTM data; B2B teams with at least 12 months of linked pipeline data.
Pro Tip: Use rule-based models for week-to-week optimization decisions and reserve data-driven attribution for quarterly budget-setting reviews. The two serve different time horizons.
How to calculate attributed revenue: formulas and a worked example
The core formula is straightforward. For any given touchpoint:
Attributed Revenue (single-touch) = Deal Value × 1.0
For multi-touch models, the formula becomes:
Attributed Revenue (touchpoint N) = Deal Value × Credit Weight for N
Where the sum of all credit weights across touchpoints equals 1.0 (100%).
Worked example
A $12,000 B2B deal closes after four touchpoints:
- Paid LinkedIn ad (first touch, 90 days before close)
- Organic blog post (60 days before close)
- Email nurture sequence (30 days before close)
- Sales demo call (5 days before close)
| Model | LinkedIn ad | Blog post | Email nurture | Demo call |
|---|---|---|---|---|
| First-touch | $12,000 | — | — | — |
| Last-touch | — | — | — | $12,000 |
The demo call looks like the revenue driver under last-touch. Under linear, the blog post and email nurture claim equal standing. Under W-shaped, the LinkedIn ad and demo call share top billing, which is closer to how most B2B teams actually think about pipeline creation. None of these is the truth. All of them are useful lenses, depending on the question you are asking.
Practical best practices and common pitfalls in attribution implementation
Most attribution failures are not software problems. They are structural: disconnected data, misaligned definitions, and CRM deal associations that nobody has audited in two years.
Best practices checklist:
- Unify your conversion taxonomy. Marketing, Sales, and Finance must agree on what counts as a lead, an MQL, an opportunity, and a closed deal before you configure any model.
- Run a 90-day UTM audit. If fewer than 90% of sessions carry complete, consistent UTM parameters, your attribution outputs are unreliable from the start.
- Fix CRM deal associations. Every closed deal should link to the contacts and activities that influenced it. Orphaned deals corrupt multi-touch calculations.
- Target a deterministic match rate of at least 60%. Below that threshold, your model is computing on fragmented journeys and producing misleading allocations.
- Set consistent attribution windows. A 30-day window in your attribution platform and a 90-day window in your CRM will produce numbers that never reconcile.
- Use server-side tracking or Conversion API. Browser-side tracking loses data to ad blockers and iOS privacy changes. Server-side implementations recover a meaningful share of that signal.
Common pitfalls:
- Dark-funnel bias. Because 70%–73% of the B2B buying journey happens before a lead self-identifies, models that only see tracked touches will systematically under-credit anonymous influence and over-credit branded search.
- Data leakage. UTM parameters stripped by redirects, link shorteners, or landing page platforms silently corrupt your source data.
- Mixing metrics with different windows. Comparing a 7-day attribution window for paid ads against a 30-day window for email creates a false picture of channel performance.
- Swapping tools before fixing data. A new attribution platform running on bad data produces bad results faster.
Treat attribution model outputs as inputs to experiments, not as board-level financial statements. The number tells you where to look; an incrementality test tells you whether the effect is real.
Pro Tip: Add a self-reported attribution field to your demo request or checkout form (“How did you hear about us?”). It captures dark-funnel influence that tracked touchpoints miss, and it costs almost nothing to implement.
How to get started with revenue attribution: a step-by-step checklist
A minimum viable attribution pilot can run in 6–12 weeks if you sequence the work correctly. Here is the order that matters.
- Set goals and KPIs (Week 1). Define what decision attribution will inform: budget reallocation, channel cuts, content investment. Owner: Marketing lead.
- Map the buyer journey (Weeks 1–2). Document every touchpoint category from first awareness to post-close. Use your customer journey mapping process as the foundation. Owner: Marketing + Sales.
- Run a 90-day UTM audit (Weeks 2–3). Pull session data and check UTM completeness. Flag any source/medium combinations that are missing, inconsistent, or labeled “(not set).” Owner: Marketing Ops.
- Align on conversion taxonomy (Week 3). Get Marketing, Sales, and Finance in a room and agree on definitions for every stage. Document them. Owner: RevOps or Marketing Ops.
- Instrument tracking (Weeks 3–5). Implement server-side tracking or Conversion API for your primary ad platforms (Meta, Google). Validate that events fire correctly in a staging environment before going live. Owner: Engineering + Marketing Ops.
- Integrate CRM with your attribution platform (Weeks 4–6). Map deal stages to touchpoint sequences. Confirm that closed-won revenue flows into the attribution tool with the correct deal values and close dates. Owner: RevOps.
- Choose a starting model and run a pilot (Weeks 6–10). Start with U-shaped or linear for B2B; time-decay or linear for ecommerce. Run the model against 90 days of historical data and compare outputs against your CRM revenue. Owner: Marketing Analyst.
- Validate with a holdout or incrementality test (Weeks 10–12). Pause one channel for a subset of your audience and measure the revenue difference. This is the only way to move from correlation to a directional causal signal. Owner: Marketing lead + Data team.
Roles at a glance:
- Marketing Ops owns UTM governance and taxonomy documentation.
- RevOps owns CRM mapping and deal association audits.
- Engineering owns server-side tracking implementation.
- Marketing lead owns model selection and pilot review.
- Finance validates that attributed revenue totals reconcile with actual closed revenue.
What tools do you need for revenue attribution?
Attribution is not a single tool. It is a stack of systems that need to talk to each other. Understanding the categories helps you assess what you already have and what you are missing.
Required system categories:
- Analytics and web measurement. Google Analytics 4 is the baseline for most teams. It captures session-level behavior and, with proper event configuration, feeds conversion data into attribution models. Limitation: GA4’s attribution is session-scoped and does not natively link to CRM deal values.
- CRM. Your CRM (Salesforce, HubSpot, or similar) holds the ground truth: deal values, close dates, and contact histories. Without clean CRM data, no attribution model produces reliable outputs. This is the system of record that every other tool should reconcile against.
- Customer Data Platform (CDP) or identity layer. A CDP stitches together anonymous and known user identities across devices and sessions. This is what enables deterministic matching. Without it, multi-touch models compute on fragmented journeys. Segment and mParticle are representative examples.
- Server-side tracking or Conversion API. Meta’s Conversions API and Google’s Enhanced Conversions send event data from your server rather than the browser, recovering signal lost to ad blockers and privacy restrictions. This is no longer optional for teams that rely on paid social.
- Dedicated revenue attribution platform. Specialized platforms sit on top of your CRM and analytics stack, pulling in touchpoint data and applying configurable models. They typically offer better multi-touch logic and revenue reconciliation than GA4 alone. The trade-off is cost and integration complexity.
Build vs. buy:
A CDP plus a BI tool (Looker, Tableau, or similar) can replicate much of what a dedicated attribution platform does, but it requires engineering resources to build and maintain the data pipelines. Dedicated attribution platforms reduce that engineering burden at the cost of flexibility. For most ecommerce brands under $50M in annual revenue, a well-configured GA4 plus CRM integration plus a Klaviyo email attribution setup covers the majority of use cases. Analytics-driven marketing consistently outperforms spend-based guesswork regardless of which specific platform you use.
For teams running multi-channel funnels across paid, email, and organic, the integration between your email platform and your CRM is often the highest-leverage connection to build first, because email attribution data is typically cleaner and more complete than paid-channel data.
A Swyftinteractive attribution pilot: what the work actually looks like
When Swyftinteractive works with an ecommerce brand on attribution setup, the engagement typically starts with a finding that surprises the client: their email channel is generating far more revenue than last-touch reporting shows.
Baseline situation (representative of typical client starting point):
- UTM completeness below 70%, with email campaigns using inconsistent or missing source parameters.
- Klaviyo revenue reporting and GA4 revenue totals disagreeing by 30%–40%, with no documented reason.
- Last-touch model in place, crediting paid search for the majority of revenue.
- No CRM deal association audit had been run in over 12 months.
Actions taken:
- Full UTM audit across 90 days of traffic; standardized naming conventions documented and enforced in Klaviyo and paid ad platforms.
- CRM deal association review: linked orphaned deals to contact records and corrected close-date timing.
- Implemented a linear attribution model alongside the existing last-touch setup to run in parallel for 60 days.
- Configured Klaviyo flow attribution windows to match the CRM opportunity window.
- Added a self-reported attribution field to the checkout confirmation page.
What the pilot revealed:
- Email nurture flows, specifically abandoned cart and post-purchase cross-sell sequences, appeared in 55%–60% of closed-won journeys under linear attribution, versus under 15% under last-touch.
- Paid search was still the top first-touch channel, but its mid-funnel contribution was minimal.
- Organic content drove a disproportionate share of first and second touches for the highest-LTV customer segment.
Replicable lessons:
- Fix UTM completeness before drawing any conclusions from model outputs.
- Run two models in parallel for at least 60 days before making budget decisions based on either.
- Klaviyo’s built-in attribution is a starting point, not a final answer. Cross-reference it against CRM data.
- Self-reported attribution captures intent signals that tracked data misses entirely.
Key Takeaways
Revenue attribution is a decision framework, not a perfect accounting system. Treat model outputs as directional signals that tell you where to run experiments, not where to declare winners.
| Point | Details |
|---|---|
| What attribution measures | It maps closed-won deal value to the touchpoints that influenced it, not just the last click. |
| Model trade-offs | Single-touch is simple but misleading; multi-touch is more complete but requires clean data and agreed definitions. |
| Critical data checks | UTM completeness above 90% and a deterministic match rate above 60% are prerequisites for reliable outputs. |
| Pilot-first approach | Run a 6–12 week pilot with two models in parallel before making budget decisions based on attribution data. |
| Swyftinteractive | Swyftinteractive sets up attribution infrastructure, Klaviyo flow measurement, and CRM mapping for ecommerce brands. |
Why attribution is a lever, not a trophy
Most marketing teams approach attribution as a credit-claiming exercise. They want the model that gives their channel the most revenue. That framing is the wrong one, and it produces the wrong behavior.
The more useful frame: attribution is a lever for resource allocation and experimentation. When you see that organic content appears in 60% of high-LTV journeys but receives almost no budget, that is a signal to run a test, not a reason to declare organic the winner. When paid social shows up consistently at first touch but rarely at mid-funnel, that tells you something about how to sequence your messaging, not just how to split credit.
The teams that get the most value from attribution are the ones that schedule recurring attribution reviews, not just quarterly, but monthly, and use the outputs to generate hypotheses. They pair multi-touch signals with self-reported attribution data and periodic incrementality tests for any budget-level decision. That combination reduces the blind spots that come from dark-funnel bias and model assumptions.
Leadership has a specific role here. If the KPIs for Marketing and Sales are set in ways that make attribution a political tool rather than a shared signal, the data will be used to defend turf instead of improve decisions. Aligning KPIs around pipeline velocity and revenue contribution, rather than leads generated or deals closed in isolation, changes how both teams use the data.
Attribution models suggest influence but do not prove causation. The moment a team treats a model output as objective truth is the moment the model stops being useful.
Swyftinteractive’s attribution and ecommerce growth services
If attribution work keeps stalling because the data infrastructure is not in place, that is the problem Swyftinteractive solves first. The agency’s analytics and attribution setup service covers UTM governance, CRM deal association mapping, Klaviyo flow attribution configuration, and integration between your email platform and your analytics stack. That foundation is what makes any model output worth acting on.
From there, Swyftinteractive’s Klaviyo lifecycle audit and strategy service identifies which email flows are contributing to revenue and which are not, using attribution data to prioritize what gets rebuilt or expanded. Clients who complete the audit typically find that two or three underperforming flows account for a significant share of missed revenue, and fixing them does not require a platform change.
For brands that want the full picture, Swyftinteractive’s ecommerce growth strategy service combines attribution setup, website conversion optimization, paid ads management, and email automation into a single engagement. The result is a measurement system and a growth engine that work from the same data. If you want to know which channels are actually closing revenue for your store, the right next step is an attribution audit. Book a consultation to get started.
Useful sources and further reading
The sources below are the most useful starting points for deeper implementation work, organized by what each one is best for.
- NetSuite: What Is Revenue Attribution? Best for: a clear, finance-friendly definition and overview of model types. Useful when aligning with a CFO or Finance team.
- Ziellab: Revenue Attribution — Why Your Multi-Touch Model Lies Best for: understanding dark-funnel bias, B2B-specific pitfalls, and why models should be treated as directional tools rather than objective truth.
- Pedowitz Group: Fix Revenue Attribution Breakdowns in Marketing Ops Best for: diagnosing structural attribution failures caused by data architecture and team misalignment.
- Pedowitz Group: Revenue Marketing Attribution Best for: practical guidance on using attribution to reduce CAC and accelerate deals, with a revenue marketing lens.
- Fairview: Multi-Touch Attribution Guide Best for: UTM audit methodology, deterministic match rate targets, and implementation prerequisites.
- Cometly: Attribution Data Not Matching Sales Best for: diagnosing and fixing mismatches between attribution platform outputs and CRM revenue totals.
- Cometly: Revenue Attribution Modeling Guide Best for: understanding data-driven attribution prerequisites and how algorithmic models differ from rule-based ones.
- Amplitude: Revenue Attribution Glossary Best for: a concise, platform-neutral definition suitable for onboarding new team members or writing internal documentation.
FAQ
What does revenue attribution mean?
Revenue attribution is the practice of assigning a portion of closed-won deal value to the marketing and sales touchpoints that influenced the purchase. It answers which channels and campaigns contributed to actual revenue, not just clicks or leads.
How do you calculate attributed revenue?
Select an attribution model, map all touchpoints in the customer journey, and multiply the deal value by the credit weight each model assigns to each touchpoint. The sum of all touchpoint credits equals the total deal value.
What is the difference between revenue attribution and conversion tracking?
Conversion tracking counts actions (form fills, purchases, demo requests) without assigning dollar values to the path that led there. Revenue attribution ties a specific deal value to each touchpoint across the full journey, making it a more useful tool for budget decisions.
What is attributable revenue?
Attributable revenue is the portion of closed revenue that can be traced to a specific marketing or sales activity. It includes revenue from customers who engaged with identifiable campaigns, channels, or sales interactions before purchasing.
Which attribution model should ecommerce teams start with?
Linear or time-decay attribution works well as a starting point for ecommerce, because both models acknowledge the role of email nurture and mid-funnel content that last-touch models systematically miss. Run it in parallel with your existing last-touch setup for 60 days before making budget decisions.