
TL;DR:
- Marketing metrics reveal why sales stop growing and inform next steps for e-commerce growth.
- Key metrics like conversion rate, CAC, and LTV directly impact revenue and retention strategies.
- Regular segmentation, review, and automation improve decision-making and competitive advantage.
Sales numbers feel satisfying until they stop growing and you don’t know why. Revenue tells you what happened, but marketing metrics tell you why it happened and, more importantly, what to do next. Most e-commerce marketing managers sit on mountains of data yet rely on surface-level numbers to guide million-dollar decisions. That gap between collecting data and actually using it is where competitors gain ground. This article breaks down what marketing metrics are, which ones drive real e-commerce growth, and how to apply them to your campaigns in a way that moves the needle on both engagement and revenue.
Table of Contents
- What are marketing metrics?
- The most impactful marketing metrics for e-commerce
- Common pitfalls and misconceptions when tracking metrics
- How to use marketing metrics to optimize campaigns
- Tracking and reporting: best practices for e-commerce teams
- Why mastering metrics gives you an edge
- Next step: Transform metrics into momentum
- Frequently asked questions
Key Takeaways
| Point | Details |
|---|---|
| Metrics drive smart growth | Understanding which marketing metrics matter most helps e-commerce brands make better, faster decisions. |
| LTV:CAC is a must-track ratio | A healthy business model shows a customer lifetime value at least three times the acquisition cost. |
| Segmentation reveals insights | Breaking metrics down by device, customer type, or channel uncovers actionable opportunities competitors miss. |
| Ongoing tracking is essential | Regular reviews and streamlined reporting help teams spot trends, correct issues, and seize growth chances early. |
What are marketing metrics?
Marketing metrics are quantitative measures used to evaluate how well your marketing efforts are performing. Think of them as the vital signs of your campaigns. Just as a doctor reads blood pressure and heart rate to understand your health, you read conversion rate and customer lifetime value to understand your business.
It helps to separate metrics from KPIs (key performance indicators), because they are not the same thing. A metric is any data point you can measure: sessions, clicks, open rates, bounce rates. A KPI is a chosen metric that connects directly to a business goal. Every KPI is a metric, but not every metric earns KPI status. Knowing this distinction saves you from tracking numbers just because you can.
Marketing metrics are essential for understanding customer value, acquisition, and engagement. In e-commerce, that means looking beyond your shopping cart totals and asking sharper questions about where customers come from, what it costs to get them, and how much they spend over time.
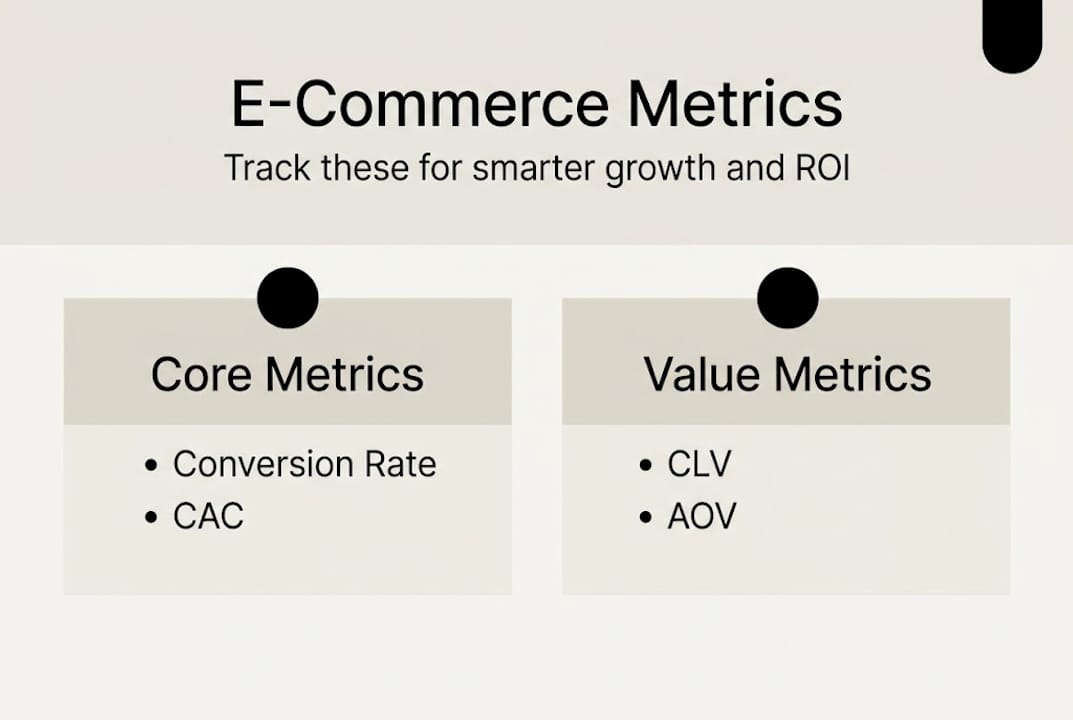
Here are the most relevant metrics for e-commerce teams, each with a quick explanation:
- Conversion rate (CR): The percentage of visitors who complete a purchase or desired action.
- Customer acquisition cost (CAC): The total spend required to acquire one new customer.
- Customer lifetime value (LTV): The total revenue a customer generates across their relationship with your brand.
- Average order value (AOV): The mean dollar amount of each transaction.
- Email engagement rate: The combined rate of opens, clicks, and actions taken from email campaigns.
- Return on ad spend (ROAS): Revenue generated per dollar of ad spend.
- Cart abandonment rate: The percentage of shoppers who add items but don’t complete checkout.
Tracking these through well-designed ecommerce engagement metrics systems gives your team a shared language for measuring progress and spotting problems before they compound.
The most impactful marketing metrics for e-commerce
Not all metrics deserve equal attention. The five below are the ones that most directly connect your marketing activity to revenue, retention, and growth.
| Metric | Definition | Why it matters | E-commerce nuance |
|---|---|---|---|
| Conversion rate (CR) | % of visitors who buy | Directly ties traffic to revenue | Varies heavily by device and traffic source |
| Customer acquisition cost (CAC) | Total spend / new customers | Measures efficiency of growth | Must stay well below LTV |
| Customer lifetime value (LTV) | Revenue per customer over time | Guides how much you can afford to spend | Email and loyalty programs lift this significantly |
| Average order value (AOV) | Revenue / number of orders | Reveals upsell and bundle opportunities | Promos and thresholds (free shipping) influence this |
| Engagement rate | Interactions / reach | Shows content and email resonance | High engagement predicts retention |
A healthy LTV:CAC ratio sits at 3:1 or better, meaning for every dollar spent acquiring a customer, you recover three in revenue. Elite e-commerce brands push that to 5:1 or higher through retention and automation.
Here’s how to start tracking these metrics in a structured way:
- Define your data sources. Confirm which platforms (Google Analytics, Klaviyo, your e-commerce platform) hold each metric.
- Set baseline values. Pull 90 days of historical data to establish where you stand today.
- Assign ownership. Each metric should have a team member or role responsible for monitoring it.
- Build your dashboard. Centralize your metrics in a single view so nothing gets siloed.
- Schedule regular reviews. Weekly pulse checks and monthly deep dives keep teams aligned and reactive.
Learning to track e-commerce metrics properly from the start prevents the painful process of reverse-engineering bad decisions months later. If you’re still figuring out which numbers qualify as ecommerce KPIs, starting with this five-metric framework gives you a solid foundation.

Pro Tip: Always segment your data by channel (paid, organic, email) and by customer type (new vs. returning). Aggregate numbers can look healthy while hiding a failing channel underneath.
Common pitfalls and misconceptions when tracking metrics
Understanding the right metrics is half the battle, but knowing how to interpret them correctly is just as important.
“Relying on aggregate conversion rate alone is one of the most dangerous habits in e-commerce analytics. The blended number can mask dramatically different performance across devices, customer segments, and traffic sources.” Aggregate conversion rate can hide important differences across segments and devices.
Here are the mistakes e-commerce managers make most often:
- Ignoring segmentation. A 2.5% overall conversion rate sounds decent until you realize mobile converts at 1.1% and desktop at 4.2%. That gap is your opportunity.
- Chasing vanity metrics. Impressions, follower counts, and raw traffic feel good on reports but rarely connect to revenue without additional context.
- Failing to tie metrics to outcomes. Tracking email open rates without linking them to revenue impact tells you almost nothing actionable.
- Treating metrics as static. What counted as a strong ROAS two years ago may signal underperformance today given rising ad costs and increased competition.
Mobile deserves special attention. Most e-commerce brands see the majority of their traffic come from mobile, yet conversion rates on mobile often lag desktop by 40% or more. Ignoring that split is leaving real money on the table. Similarly, new and returning customers behave very differently. Blending them into one metric pool skews your view of acquisition efficiency and retention health.
For teams serious about conversion rate optimization, segmentation is non-negotiable. Even basic splits by device and traffic source reveal patterns that averaged data buries. You can find additional perspective on multilingual conversion strategies and how customer experience variables affect conversion at a granular level.
Pro Tip: Before your next campaign debrief, pull conversion rates separately for mobile, desktop, new visitors, and returning customers. Compare them across channels. The differences will surprise you and give you a clearer action plan than any blended number ever could. Reviewing conversion rate tips built for e-commerce teams is a practical next step.
How to use marketing metrics to optimize campaigns
Once common pitfalls are out of the way, it’s time to put your understanding of marketing metrics into action.
Here’s a real-world example of what metric-driven improvement looks like in practice:
| Metric | Before optimization | After optimization | Revenue impact |
|---|---|---|---|
| Conversion rate | 1.8% | 2.6% | +44% revenue from same traffic |
| Customer acquisition cost | $38 | $27 | Freed $110K in annual ad budget |
| Customer lifetime value | $145 | $198 | Justified higher spend per customer |
These shifts don’t happen by accident. Tracking metrics enables the kind of campaign optimization that produces compounding growth, not one-time wins.
Follow these steps to apply your metrics to active campaigns:
- Diagnose first. Identify the one metric showing the biggest gap between current performance and your target.
- Form a hypothesis. If CAC is high, is it the ad creative, the landing page, or the audience targeting?
- Test one variable. Change a single element, run the experiment, and give it enough time to reach statistical significance.
- Analyze the result. Did the change move the metric in the right direction? Did it affect other metrics unexpectedly?
- Iterate and scale. Double down on what worked. Archive what didn’t. Apply the learning to the next cycle.
Even a single metric shift creates a ripple effect. Improving conversion rate by 0.8 percentage points on $500K in annual traffic is worth hundreds of thousands in added revenue without spending another dollar on ads. Email marketing analytics and Klaviyo analytics tracking make this level of granular testing and attribution far more accessible for e-commerce teams. For broader context on data-driven marketing strategies, it’s worth seeing how leading brands connect metrics to decision cycles.
Tracking and reporting: best practices for e-commerce teams
Optimizing campaigns is easier with strong measurement habits. Here’s how top e-commerce teams stay accountable and proactive.
Ongoing tracking and analysis is essential for sustained marketing improvements, not just for quarterly reporting exercises. Brands that build a measurement rhythm into their weekly operations catch problems and opportunities far earlier than those who check in quarterly.
Best practices for consistent tracking:
- Establish weekly pulse reviews. Spend 30 minutes every week scanning your core metrics for unexpected movement up or down.
- Build centralized dashboards. One view per team (marketing, product, leadership) prevents data from getting siloed and misinterpreted.
- Segment your reports by channel and product category. Email, paid, and organic each deserve their own analysis lane.
- Share metric summaries with cross-functional teams. When product, customer service, and marketing see the same numbers, decisions align faster.
- Run monthly deep dives. Monthly reviews are where trends become visible and strategic pivots get planned.
A practical example: one e-commerce team added a weekly 30-minute metric review and discovered that their SMS campaign was driving a 10% better AOV than email. That single finding redirected budget and added meaningful revenue within one quarter. Understanding the role of analytics in e-commerce and pairing it with the right e-commerce marketing strategies makes your reporting rhythm a competitive asset.
Why mastering metrics gives you an edge
Here’s the uncomfortable truth about marketing metrics: most e-commerce brands are already collecting the data they need. The problem isn’t access, it’s attention.
Teams that consistently outperform their competitors aren’t using more tools. They’re asking sharper questions about the numbers they already have. They follow up when a metric dips 5%. They segment automatically rather than when something looks wrong. They connect micro-level findings, like a drop in email click rates, to strategic decisions, like revising their customer journey.
Tracking email engagement at the segment level, for instance, reveals which customer groups are drifting toward churn before it shows up in revenue. That’s the kind of early signal that separates reactive brands from proactive ones.
The brands that win aren’t necessarily the ones with the biggest budgets. They’re the ones treating their metrics as a living system rather than a static report. Build that habit and you won’t just react to your market. You’ll anticipate it.
Next step: Transform metrics into momentum
Understanding your marketing metrics is the foundation. Turning them into consistent revenue growth requires the right systems, automation, and expertise behind the execution.
At Swyft Interactive, we specialize in helping e-commerce brands move from data overwhelm to data-driven momentum. We build the automated email workflows and reporting infrastructure that make your metrics work for you around the clock. Whether you need a full growth strategy automation overhaul or simply want to track marketing metrics more effectively, our team brings the Klaviyo expertise and e-commerce focus to get you there faster. Let’s turn your numbers into your next growth engine.
Frequently asked questions
What is the difference between a marketing metric and a KPI?
A marketing metric is any measured data point in your marketing activity, while a KPI is a selected metric tied directly to a specific business goal. Not all metrics qualify as KPIs.
Which marketing metric should I prioritize first for e-commerce?
Start with conversion rate as your baseline, then layer in customer acquisition cost and customer lifetime value. A healthy LTV:CAC of 3:1 or better is the target for sustainable growth.
How often should marketing metrics be reviewed?
Weekly reviews keep your team responsive to changes, while monthly deep dives reveal trends that shorter windows miss. Both rhythms together give you the best balance of speed and strategic clarity.
How do I know if my metrics are ‘good’?
Benchmark against industry standards for your category and device type, but prioritize consistent improvement over absolute perfection. An elite LTV:CAC of 5:1 or more is a strong long-term target.
What tools help automate marketing metric tracking?
Klaviyo, Google Analytics, and centralized dashboard platforms like Looker Studio automate data collection and surface the insights your team needs without manual data pulls.