
TL;DR:
- A/B testing replaces guesswork with evidence by comparing multiple variants on live traffic to determine winners. It helps optimize conversion rates, validate changes, reduce risks, prioritize roadmaps, and quantify ROI through continuous experiments. Proper discipline, pre-registration, and validation checks are essential for trustworthy results and scalable experimentation programs.
A/B testing, also called split testing, is the discipline of exposing two or more versions of a page, feature, or message to live traffic and letting measured behavior decide the winner. Its operational role is straightforward: replace opinion with evidence before committing engineering and design resources to a change. Teams use it for two core purposes:
- Optimize conversion metrics — test headlines, CTAs, checkout flows, and email subject lines against a control to find the version that drives more purchases, sign-ups, or clicks.
- Validate changes before full rollout — confirm that a new feature or redesign actually improves the primary metric rather than hurting it, so you ship with confidence rather than hope.
According to an Ascend2 survey of 402 marketing professionals, 99% of marketers in the Ascend2 survey report their A/B testing programs are at least somewhat successful, with many teams running tests monthly or weekly. That adoption rate reflects something real: experimentation is one of the few methods that ties a specific change directly to a measurable business outcome.
Three benefits stand out for product and marketing teams specifically:
Risk reduction. A failed experiment costs you the engineering time to build the variant. A failed unvalidated launch costs you conversion rate across your entire user base, sometimes permanently if users form habits around the broken experience.
Roadmap prioritization. When you have ten ideas and budget for three, experiment results give you a defensible ranking. A lift of 8% on checkout completion beats a 2% lift on homepage engagement — and you can show the data to any stakeholder who questions the call.
Quantified ROI. Knowing that a specific email subject line variant drove a 12% higher open rate, or that a simplified pricing page lifted trial sign-ups, gives finance and leadership a concrete return figure. That is far more persuasive than a post-launch attribution model that blends a dozen variables together.
For eCommerce brands in particular, the compounding effect matters. A data-driven optimization approach that runs experiments continuously across the funnel — ads, landing pages, email, checkout — accumulates gains that a single big redesign rarely matches.
Table of Contents
- When should you use A/B testing, and when should you skip it?
- How does A/B testing work? A practical step-by-step process
- What metrics and statistical checks should you trust?
- What are the most common A/B testing mistakes?
- What are the best use cases for A/B testing?
- Which tools should you use for experimentation?
- How do you build a testing culture that actually scales?
- How does an eCommerce agency run experiments for measurable uplift?
- Key Takeaways
- The part most teams get wrong about experimentation
- Swyftinteractive helps eCommerce teams run experiments that move revenue
- Useful sources and further reading
- FAQ
When should you use A/B testing, and when should you skip it?
Run an A/B test when you have a specific, measurable hypothesis and enough traffic to reach a valid conclusion within a reasonable timeframe. Skip it when you don’t.
Four checkpoints before you commit to an experiment:
- Traffic and sample size. Can you realistically reach statistical significance in four to eight weeks? If a feature gets low traffic, you likely cannot reach statistical significance in a reasonable timeframe.
- Isolated change. Is the variant changing one thing, or ten? Tests that bundle multiple changes can’t tell you which element drove the result.
- Clear primary metric. Do you have a single pre-defined success metric, not a list of five metrics you’ll evaluate after the fact?
- Directional hypothesis. Do you have a reason to believe the variant will outperform the control, or are you just curious? Curiosity is better served by user research.
Bad candidates for A/B testing include major strategic pivots (rebranding, pricing model changes that affect all customers), low-traffic features, and changes that carry high brand risk — like testing radically different tone-of-voice in customer communications where a bad result damages trust before you can stop it.
A/B testing should not be the default answer for every product question. Use user interviews and qualitative research for major strategic decisions, and reserve experiments for validating assumptions at scale.
Pro Tip: Before running an experiment, pair your quantitative hypothesis with at least one qualitative signal — a user interview finding, a session recording, or a heatmap — that explains WHY you expect the variant to win. Teams that skip this step often can’t interpret ambiguous results.
How does A/B testing work? A practical step-by-step process
A/B testing is a quantitative research method that tests two or more design variations with a live audience to determine which performs best. The canonical workflow runs like this:
- Define your primary metric and hypothesis. State what you’re measuring (e.g., checkout completion rate) and your directional prediction (e.g., “removing the coupon code field will increase checkout completion by reducing distraction”).
- Calculate required sample size. Determine your baseline conversion rate, set your Minimum Detectable Effect (MDE — the smallest lift that would justify shipping), and target 80% statistical power. Underpowered tests miss real effects; sample size estimation plays a crucial role in ensuring inference has sufficient power and Type I error control.
- Design variants. Build the control (A) and one or more variants (B, C). Keep changes isolated.
- Randomize and run. Use your experimentation platform to randomly assign users to groups. Confirm the allocation is correct before collecting data.
- Monitor for SRM and instrumentation issues. Check Sample Ratio Mismatch (SRM) within the first 24–48 hours. If your 50/50 split is showing 52/48, stop and investigate before interpreting results.
- Analyze effect size and confidence interval. At the pre-specified end date, look at the measured lift, its confidence interval, and whether the effect size clears your MDE threshold.
- Validate with guardrails and holdouts. Check guardrail metrics (metrics you don’t want to harm) and, for significant changes, retain a small holdout group to validate long-term impact.
- Ship or iterate. If the variant wins on the primary metric and clears guardrails, ship it. If results are flat or negative, document the learning and move to the next hypothesis.
A typical experiment on a mid-traffic eCommerce site runs two to four weeks. Shorter tests risk novelty effects; longer tests risk seasonal confounds. The timeline is driven by sample size, not calendar preference.
Pro Tip: Pre-register your analysis decisions before the experiment starts: write down your primary metric, your MDE, your planned end date, and your stopping rules. Teams that decide these after seeing early results dramatically inflate their false-positive rate.

What metrics and statistical checks should you trust?
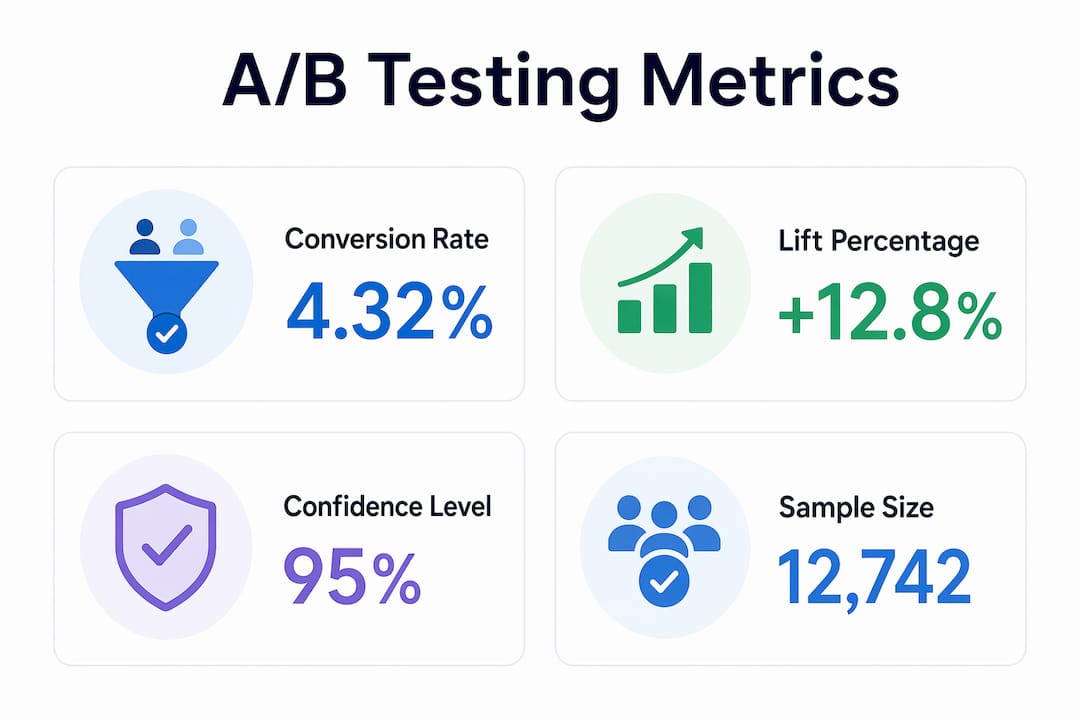
The metrics that decide winners in a well-run experiment are conversion rate, absolute lift, relative lift, confidence interval, statistical power, and MDE. Together, they tell you whether a result is real and whether it’s worth acting on.
| Metric | Definition | What it tells you |
|---|---|---|
| Conversion rate | Percentage of users completing the target action | Baseline performance and variant performance |
| Absolute lift | Variant rate minus control rate | The raw change in percentage points |
| Relative lift | Absolute lift divided by control rate | Proportional improvement; easier to compare across tests |
| Confidence interval (CI) | Range likely to contain the true effect | Width signals precision; a wide CI means more data needed |
| Statistical power | Probability of detecting a real effect if one exists | Set at 80% minimum; lower means you’ll miss real wins |
| MDE | Smallest effect worth detecting, set before the test | Drives sample size; too small an MDE requires impractical traffic |
Three validity checks every analyst should run before declaring a winner:
- SRM check. If actual group sizes deviate from expected allocation, SRM indicates broken randomization and invalidates results until the routing issue is fixed.
- Instrumentation parity. Confirm that both groups are tracked identically. A missing event tag on the variant is one of the most common sources of false wins.
- Avoid peeking. Frequent monitoring can move Type I error from 5% to over 25% without sequential methods or pre-specified stopping rules. If you need to monitor early, use a sequential testing framework.
For teams running many experiments simultaneously, CUPED (Controlled-experiment Using Pre-Experiment Data) is worth knowing. Microsoft and Netflix reported variance reductions using CUPED that effectively act like increasing traffic by roughly 20–40%, shortening time to significance without adding users.
Pro Tip: A statistically significant result is not automatically a shipping decision. Small lifts — even 0.3% — can clear significance thresholds without justifying the engineering cost. Always ask: does the effect size clear our MDE, and does the confidence interval exclude zero by a meaningful margin?
What are the most common A/B testing mistakes?
Most false wins in A/B testing trace back to data quality and process failures, not statistical bad luck. The instrumentation is broken, the randomization is off, or someone stopped the test early because the variant was winning at day three.
Validation checklist before you trust a result:
- Run the SRM test on day one. A 52/48 split when you expected 50/50 is a red flag, not a rounding error.
- Confirm event parity: both groups must fire the same tracking events with the same logic.
- Filter bots and internal traffic before analysis, not after.
- Lock your segmentation plan before the experiment starts. Post-hoc segmentation (“the variant won among mobile users in the Midwest”) is data dredging, not analysis.
- Monitor guardrail metrics throughout the run, not just at the end.
Three specific mistakes worth naming explicitly:
Peeking and stopping early. A team sees the variant winning at day five of a planned 21-day test and ships it. The result was noise. Three weeks later, the metric reverts. This is the single most common source of false positives in practice.
Post-hoc segmentation. Running 20 segment cuts on a flat result until one shows significance is not insight — it’s a false discovery. The multiple comparisons problem means roughly one in twenty cuts will show significance by chance at a 95% confidence level.
Shipping without holdouts. A variant wins on a two-week test. Six weeks later, the lift has disappeared. Novelty effects are real, and a small holdout group (5–10% of users who never see the new experience) is the only reliable way to measure long-term impact.
Pro Tip: Keep a holdout group of a small portion of your user base outside all active experiments. Measure the gap between the holdout and the general population monthly. This is the only way to know whether your experimentation program is generating real cumulative lift or just novelty-driven spikes.
What are the best use cases for A/B testing?
The strongest candidates for A/B testing share three traits: high traffic, a clear conversion event, and a specific, isolated change. Landing pages, CTAs, checkout flows, email subject lines, and pricing page layouts are the workhorses of most experimentation programs.
Common use cases and what makes each a good fit:
- Homepage hero and headline. High traffic, single conversion event (click-through to product or sign-up). Even a 5% lift on a high-volume page compounds quickly. Typical test duration: two to three weeks.
- CTA button copy and color. Low engineering cost, isolated change, measurable click rate. A classic microtest with fast turnaround.
- Checkout flow steps. High business impact, but requires careful instrumentation across multiple steps. Test one step at a time. Email split testing follows the same logic: one variable per send.
- Email subject lines. Fast results (24–48 hours), clear metric (open rate), easy to run at scale. The most accessible entry point for teams new to experimentation.
- Pricing page layout. High impact, but also high risk. A pricing test that confuses users can suppress conversions for weeks. Run with a conservative MDE and tight guardrails.
For omnichannel retail teams, the same principles apply across in-store digital touchpoints, loyalty program messaging, and app push notifications — the metric changes, but the experimental logic doesn’t.
Two quick vignettes that show how metric, hypothesis, and impact connect:
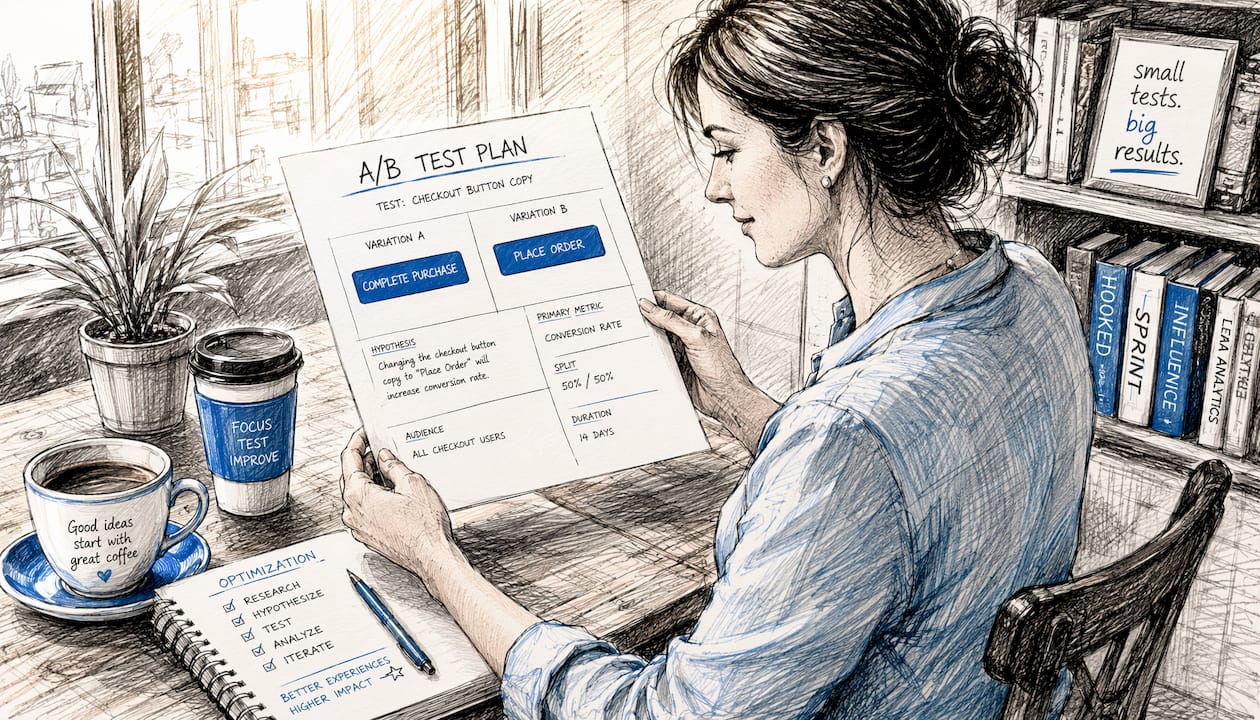
Checkout button copy. Hypothesis: changing “Complete Purchase” to “Place My Order” reduces hesitation and increases checkout completion. Metric: checkout completion rate. Expected impact: a moderate relative lift. Low engineering cost, fast to validate.
Abandoned cart email timing. Hypothesis: sending the first abandoned cart email at one hour post-abandonment (vs. four hours) recovers more revenue. Metric: recovered revenue per send. Expected impact: meaningful lift in recovery rate. Easy to instrument in Klaviyo, results in 48–72 hours.
Which tools should you use for experimentation?
Tool selection is a stack decision, not a vendor beauty contest. The right platform depends on your team size, traffic volume, whether you need client-side or server-side testing, and how tightly the tool needs to integrate with your analytics and feature delivery systems.
Three broad categories cover most teams:
Visual/WYSIWYG platforms are built for marketers who need to test page elements without engineering support. They work client-side, which means they’re fast to deploy but can introduce flicker and are limited to front-end changes. Best for landing page and CTA tests.
Full-stack and feature-flag platforms run experiments server-side, which means they can test backend logic, pricing algorithms, recommendation engines, and app features — not just visual elements. They also support gradual rollouts and kill switches. This is where Optimizely and VWO (Visual Website Optimizer) operate across both categories, with Optimizely’s full-stack product handling server-side feature experimentation and VWO covering both visual and server-side use cases. Adobe Target adds personalization and AI-driven audience segmentation on top of standard A/B capabilities, making it a fit for enterprise teams with complex targeting needs.
Analytics-integrated experimentation. Google Analytics (via GA4’s built-in experiment features and integrations with Google Optimize’s successor tools) lets teams tie experiment data directly to their existing reporting. The tradeoff is less experiment governance and fewer advanced features compared to dedicated platforms.
Dimensions to evaluate when choosing:
- What can you test (front-end only vs. full-stack)?
- How does the platform handle sample-size calculation and significance reporting?
- Does it integrate with your data warehouse, CDP, or email platform?
- Does it support feature flags for gradual rollouts and instant rollbacks?
- What does experiment governance look like — is there a registry, access controls, and audit logs?
Pro Tip: Connect your experimentation platform to your analytics stack before you run your first test, not after. Experiment data that lives in a silo — separate from your revenue metrics, email engagement data, and customer segments — is nearly impossible to act on at scale.
How do you build a testing culture that actually scales?
The hardest challenges in experimentation are cultural, not statistical. Enforcing holdouts, preventing early stopping, and building a discoverable log of experiments separate from metrics dashboards is what separates programs that scale from programs that plateau.
The single most important cultural factor is discipline in analysis and follow-through. Teams that check results daily, stop tests early when the variant is winning, and never document negative results are running a theater of experimentation, not a real program.
Roles in a functioning experiment program:
- Experiment owner (PM or marketer). Writes the hypothesis, defines the primary metric, and owns the shipping decision.
- Analyst or data scientist. Calculates sample size, runs validity checks (SRM, instrumentation), and interprets results.
- Engineer. Instruments events, builds variants, and sets up the randomization layer.
- Data steward. Maintains the experiment registry, enforces pre-registration, and flags conflicts between concurrent tests.
- Marketing or product stakeholder. Reviews results and connects findings to roadmap decisions.
Prioritization framework: Score experiment candidates on impact (expected lift × affected traffic volume), confidence (strength of the qualitative or quantitative signal behind the hypothesis), and cost (engineering and design effort). Run high-impact, high-confidence, low-cost experiments first. This is the ICE framework in practice, and it keeps experimentation resources focused on bets that are likely to pay off.
Ethics note. Experiments that touch pricing, consent flows, or sensitive customer communications require additional guardrails. Never run a pricing test that shows materially different prices to the same customer across sessions without a clear disclosure policy. For experiments involving personal data, confirm compliance with applicable privacy regulations before launch.
Pro Tip: Maintain a central experiment registry — a shared document or tool where every test is logged with its hypothesis, start date, end date, primary metric, and result. Teams without this end up re-running experiments that already have answers, and they can’t audit which concurrent tests might be interfering with each other.
How does an eCommerce agency run experiments for measurable uplift?
Disciplined experimentation in eCommerce consistently produces measurable conversion and revenue gains when the workflow is structured around clear hypotheses, proper instrumentation, and holdout validation. The conversion rate optimization approach that Swyftinteractive applies to eCommerce clients follows a repeatable five-stage cycle.
The agency workflow:
- Hypothesis generation. Pull from analytics (drop-off points, funnel leakage, segment performance gaps) and customer research (support tickets, post-purchase surveys, session recordings). Every test starts with a “because” statement: “We believe X because Y data shows Z.”
- Test design and QA. Define the primary metric, MDE, and sample size before building variants. Run instrumentation checks and confirm event parity across control and variant before launch.
- SRM and early monitoring. Check allocation ratios within 48 hours. Flag any deviation for engineering review before results accumulate.
- Short experiment window. Run for the pre-specified duration. No early stopping, no peeking at conversion rates mid-test.
- Holdout validation and rollout decision. For tests showing a win, retain a 5–10% holdout group for four to six weeks post-launch to confirm the lift holds. Only then does the change go to 100% of traffic.
The KPIs Swyftinteractive monitors across eCommerce experiments: conversion rate (primary), AOV, email engagement rate (for email split tests), and 30-day retention. Results map to revenue by multiplying the measured lift against monthly traffic and average order value, giving clients a concrete dollar figure tied to each experiment. For teams building out their email automation workflows, this same experimental rigor applies to Klaviyo flow variants, subject line tests, and send-time optimization.
Key Takeaways
A/B testing’s role is to replace opinion with measured evidence before committing resources, and the programs that deliver compounding results are the ones built on pre-registered hypotheses, SRM checks, and holdout validation.
| Point | Details |
|---|---|
| Pre-register before you run | Lock your primary metric, MDE, and stopping rules before the experiment starts to avoid inflated false positives. |
| SRM check is non-negotiable | Any notable deviation from the expected 50/50 split invalidates results; check allocation within 48 hours of launch. |
| Statistical significance ≠ shipping decision | A 0.3% lift can clear significance thresholds without justifying engineering cost; always evaluate effect size against your MDE. |
| Holdouts validate long-term lift | Keep 5–10% of users outside active experiments to confirm that wins aren’t novelty effects. |
| Swyftinteractive’s approach | Swyftinteractive applies this experimental workflow to eCommerce clients, tracking conversion rate, AOV, and retention to map results directly to revenue. |
The part most teams get wrong about experimentation
Most articles on A/B testing spend their energy on the statistics. The math matters, but it’s not where programs fail. The failure mode is almost always upstream: a team that checks results every morning, stops the test when it looks good, and moves on without documenting what they learned. Six months later, they’re running the same experiment again because no one remembers the first result.
The governance layer — pre-registration, a central experiment registry, holdout groups, and a culture that treats a null result as information rather than failure — is what separates teams that compound their learning from teams that spin their wheels. Peeking at results before the planned end date can push your false-positive rate from 5% to over 25%. That’s not a statistical footnote; it’s the difference between a program that builds real knowledge and one that generates noise.
The other underrated point: qualitative research and A/B testing are not competing methods. User interviews tell you why users behave a certain way. Experiments tell you whether a specific change moves a specific metric. The strongest product and marketing teams use both, in sequence. Interview first to generate the hypothesis. Test to validate it at scale.
Swyftinteractive helps eCommerce teams run experiments that move revenue
Running a disciplined experimentation program takes more than a testing platform. It takes instrumentation, hypothesis development, proper statistical setup, and a workflow that connects test results to actual revenue decisions.
Swyftinteractive works with eCommerce brands to build and run exactly that. The agency handles experiment design, event instrumentation and QA, Klaviyo email split testing, holdout study setup, and full-funnel analytics so your team gets results you can trust and act on. Whether you’re testing checkout flows, pricing page layouts, or email automation sequences, the workflow is the same: pre-registered hypothesis, SRM-validated data, holdout-confirmed lift, and a clear revenue figure attached to every winning result.
If your team is ready to move from ad hoc testing to a repeatable experimentation program, see how Swyftinteractive approaches eCommerce optimization and get in touch to discuss your current funnel and where experiments can have the most impact.
Useful sources and further reading
- Ascend2 A/B Testing in Marketing Research (survey PDF) — Survey of 402 marketing professionals on adoption rates, frequency, and perceived effectiveness. Useful for benchmarking your program against industry norms.
- NN/g: A/B Testing 101 — Practitioner-level definition and methodological framing from Nielsen Norman Group. Good starting point for teams new to the method.
- PMRead: A/B Testing for Product Managers — Covers what to test, what to skip, and how to interpret results with a PM-focused lens. Strong on MDE and practical significance.
- KDnuggets: A/B Testing Pitfalls — Covers SRM, instrumentation bugs, CUPED, and cultural failure modes. One of the more honest practitioner accounts of where programs break down.
- Towards Data Science: Why Most A/B Tests Are Lying to You — Deep dive on peeking, false-positive inflation, and why Bayesian methods don’t eliminate stopping-rule problems.
- ACM CIKM: Sample-Size Calculations for A/B Testing — Academic paper on sample size estimation for correlated data and absolute vs. relative effects. Useful for analysts who need rigorous methods beyond standard calculators.
- Wikipedia: A/B Testing — Broad overview with historical context and links to related methods. Good for orienting new team members.
- Reddog Consulting: A/B Testing in Retail — Retail-specific perspective on omnichannel experimentation, useful for teams testing across digital and physical touchpoints.
FAQ
What is the main role of A/B testing in marketing?
A/B testing’s role is to replace guesswork with measured evidence: you expose two versions of a page, email, or feature to live users and let conversion data decide which performs better, reducing the risk of shipping changes that hurt your metrics.
When should you use A/B testing?
Use A/B testing when you have a specific, measurable hypothesis, enough traffic to reach significance in four to eight weeks, and an isolated change tied to a clear primary metric. Skip it for major strategic decisions or low-traffic features — qualitative research is a better tool there.
What are the five main purposes of running an experiment?
The core purposes are: (1) validate that a change improves a key metric before full rollout, (2) reduce the risk of shipping harmful changes, (3) quantify the business impact of UX and marketing decisions, (4) prioritize the product roadmap with evidence rather than opinion, and (5) build an institutional knowledge base of what works for your specific audience.
How long should an A/B test run?
Test duration is driven by sample size, not a fixed calendar window. Most mid-traffic eCommerce tests run two to four weeks. Stopping early because the variant looks like it’s winning is one of the most common sources of false positives, capable of pushing your error rate from 5% to over 25%.
What is Sample Ratio Mismatch (SRM) and why does it matter?
SRM occurs when the actual split between control and variant groups deviates from the intended allocation — for example, 52/48 instead of 50/50. It signals broken randomization or data routing and invalidates experiment results until the underlying issue is diagnosed and fixed.