
TL;DR:
- Performance metrics directly connect daily activities to strategic outcomes and improve organizational effectiveness. Leaders should focus on actionable KPIs like lead-to-customer rate, ROMI, and CAC, and review them regularly to ensure alignment with goals. Building accountability and clear decision triggers is essential to prevent dashboards from becoming decoration, fostering real growth.
Performance metrics are measurable indicators that reveal how well an organization is achieving its objectives. Structured KPI measurement can explain up to 62.3% of an organization’s overall effectiveness. That single figure tells you why use performance metrics is not a theoretical question. It is the most direct lever leaders have for connecting daily activity to real business outcomes. Marketing professionals who track the right key performance indicators make faster decisions, allocate budgets with confidence, and catch problems before they become expensive. This article gives you a practical framework for selecting, implementing, and governing metrics that actually move the needle.
How do performance metrics drive growth and improve decision-making?
Performance metrics create a direct link between what your team does and what the business achieves. Without that link, budget decisions rely on instinct, and instinct is expensive to be wrong about.
The importance of performance metrics shows up most clearly in marketing. 33.9% of top-performing marketing teams prioritize lead-to-customer conversion rates for full-funnel optimization, while 31.1% track Return on Marketing Investment (ROMI). These teams are not tracking everything. They are tracking what connects marketing activity to revenue.
Balanced use of financial and non-financial measures significantly improves operational efficiency and decision-making competence, confirmed by 40.58% of studies reviewed in a systematic literature review on key performance measures. That means combining a revenue metric like ROMI with an operational metric like pipeline velocity gives leaders a fuller picture than either metric alone.
The benefits of performance metrics extend beyond reporting. Metrics force clarity. When a team commits to tracking customer acquisition cost (CAC), they must define what counts as a customer, what counts as acquisition spend, and over what time period. That definitional work alone surfaces misalignments that would otherwise stay hidden for quarters.
- Lead-to-customer conversion rate shows where prospects drop out of the funnel and where sales and marketing need to align.
- ROMI connects marketing spend directly to revenue, giving finance and the C-suite a number they can act on.
- Pipeline velocity measures how fast deals move through the funnel, signaling capacity and forecasting accuracy.
- CAC tracks the true cost of growth, which matters most when scaling paid channels.
Pro Tip: Set a 90-day review cycle for your core KPIs. Metrics that were relevant when you launched a campaign may not reflect the current stage of your funnel. Reviewing quarterly prevents you from optimizing for yesterday’s problem.
What are the most important types of performance metrics for marketing and business leaders?
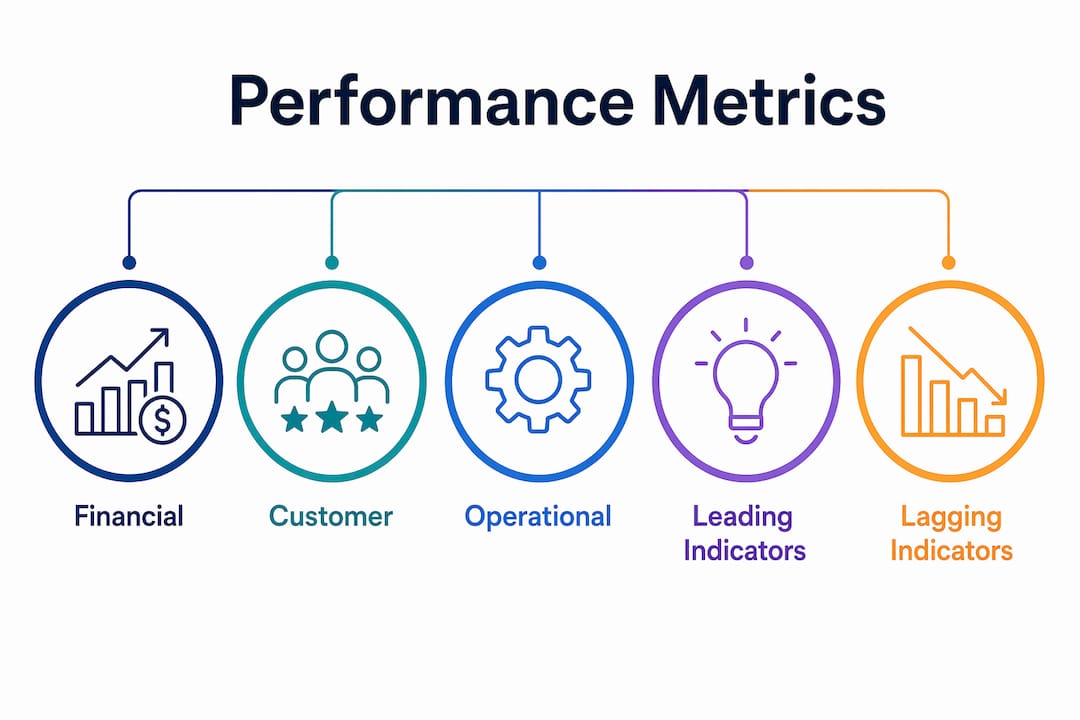
Not all metrics carry equal weight. The most effective leaders organize their metrics into categories and assign each category a clear strategic purpose.
Financial metrics
Financial metrics measure revenue impact directly. ROMI, gross margin contribution, and revenue per customer sit in this category. These are the metrics that belong in board presentations because they speak the language of business outcomes. Misaligning marketing metrics with board language erodes credibility and impairs strategic conversations about budget and growth.
Customer metrics
Customer metrics measure the quality and durability of your revenue. CAC, customer lifetime value (CLV), and net promoter score (NPS) belong here. A business can show strong revenue growth while quietly destroying CLV through aggressive discounting. Customer metrics catch that before it becomes a structural problem.

Operational efficiency metrics
Operational metrics measure how well your systems and processes perform. Conversion rates, email open rates, and cost per lead live in this category. These are the channel metrics your team uses daily. They are not wrong to track. They just should not be the only metrics in the room when strategy is being set.
Leading vs. lagging indicators
Leading indicators predict future performance. Lagging indicators confirm past performance. Pipeline velocity is a leading indicator. Revenue is a lagging indicator. Effective ecommerce KPI tracking uses both: leading indicators to steer, lagging indicators to validate.
| Metric category | Examples | Strategic focus |
|---|---|---|
| Financial | ROMI, gross margin, revenue per customer | Board-level decisions, budget allocation |
| Customer | CAC, CLV, NPS | Retention, lifetime value, acquisition efficiency |
| Operational efficiency | Conversion rate, cost per lead, email CTR | Channel performance, funnel health |
| Leading indicators | Pipeline velocity, lead quality score | Forecasting, early warning signals |
| Lagging indicators | Revenue, churn rate, market share | Validation, historical performance review |
Top marketers in 2026 prioritize lead quality (39.4%), conversion rates (33.9%), and ROMI (31.1%), with far less emphasis on vanity metrics like social media engagement. That shift reflects a broader maturity in how marketing teams think about what measuring performance metrics actually means.
How to effectively implement performance metrics in your organization
Knowing which metrics matter is half the job. Building a system that turns those metrics into decisions is the other half.
-
Align every metric to a strategic goal. A metric without a goal is just a number. Before adding a KPI to your dashboard, write one sentence explaining which business objective it serves. If you cannot write that sentence, the metric does not belong on the dashboard.
-
Define action triggers before you start tracking. A KPI system without predefined responses is just a reporting system. Decide in advance: if CAC rises 20% above target for two consecutive months, what happens? Who owns the response? What changes? Answering these questions before the data arrives removes the delay between insight and action.
-
Separate board language from channel language. Your paid media team needs ROAS and CTR. Your CFO needs revenue and margin. Mixing these two reporting layers in the same presentation confuses both audiences and weakens your credibility with each. Build two reporting views: one for channel teams, one for leadership.
-
Limit your core KPI set. Most organizations track too many metrics and act on too few. Decision fatigue is real. A focused set of five to seven core KPIs, reviewed consistently, outperforms a sprawling dashboard that nobody fully trusts.
-
Review and retire metrics regularly. A metric that drove decisions during a growth phase may become irrelevant during a consolidation phase. Schedule a formal KPI audit every six months to remove metrics that no longer connect to current strategy.
Pro Tip: Build your KPI framework around decisions, not data. For each metric, ask: “What decision does this metric enable?” If the answer is vague, replace the metric with one that has a clear decision attached to it.
Effective conversion rate optimization depends on this kind of disciplined metric governance. Teams that track conversion rates without defined thresholds and response protocols rarely improve them consistently.
What are common challenges and misconceptions about performance metrics?
The most dangerous place in a metrics program is when everything looks fine but growth has stalled. This is not a hypothetical risk. It is a documented pattern.
Performance metrics often optimize for the easiest-to-observe signals, which risks narrowing growth opportunities even when dashboard metrics appear stable. A paid search campaign can show improving ROAS while the total addressable audience shrinks. The metric improves. The business contracts.
“Dashboards alone do not make decisions. Executives must set boundaries and distinguish when metrics require strategic pivots versus tactical changes. Digital optimization is an execution engine, not a strategy.”
Common pitfalls leaders face when governing performance metrics:
- Mistaking efficiency for growth. Reducing CAC by cutting reach is efficient. It is not growth. Leaders must track absolute volume alongside efficiency ratios.
- Tracking vanity metrics. Social media follower counts and raw page views feel like progress. They rarely connect to revenue. Replace them with metrics that reflect marketing metrics and ROI impact directly.
- Ignoring incrementality. A metric showing that email drives 30% of revenue may be counting sales that would have happened anyway. Holdout tests, where a control group receives no marketing, measure true incremental impact. Without them, you risk over-crediting channels that are not actually driving growth.
- Conflating correlation with causation. Two metrics moving together does not mean one causes the other. Building strategy on correlations without testing the causal link leads to misallocated spend.
A paradox exists where stable performance metrics obscure real growth stagnation. The solution is not more metrics. It is better governance: leaders who ask harder questions of the data and design experiments to test their assumptions. Controlled experiments like holdout tests are the most reliable way to validate whether your metrics reflect real impact or just activity.
Key Takeaways
Performance metrics drive organizational effectiveness only when they are tied to decisions, governed by leadership, and reviewed against strategic goals rather than treated as passive reporting tools.
| Point | Details |
|---|---|
| Metrics explain organizational effectiveness | Structured KPI measurement accounts for up to 62.3% of overall organizational effectiveness. |
| Prioritize revenue-connected KPIs | Top teams focus on lead-to-customer conversion, ROMI, and CAC over vanity metrics. |
| Define action triggers in advance | A metric without a predefined response is a reporting exercise, not a decision tool. |
| Separate reporting layers | Use board language (revenue, margin) for leadership and channel language (ROAS, CTR) for execution teams. |
| Test incrementality | Holdout tests reveal whether metrics reflect real impact or just correlated activity. |
The metric that nobody wants to talk about
After working with ecommerce brands across multiple growth stages, the pattern I keep seeing is not a lack of data. It is a lack of accountability attached to data. Teams build dashboards, review them in weekly meetings, and then make the same decisions they would have made without the dashboard. The metrics become decoration.
The fix is cultural before it is technical. Performance management builds accountability and transparency by showing employees how their roles connect to organizational goals. That only works when leadership treats metrics as binding commitments, not suggestions. If a KPI crosses a threshold and nothing changes, the KPI loses credibility. Once that happens, the whole system erodes.
My honest recommendation: pick fewer metrics than you think you need. Own them completely. Know what you will do when each one moves in either direction. That discipline, applied consistently, produces better outcomes than any dashboard tool or reporting cadence. Data fluency without strategic conviction is just expensive noise.
— Leon
How Swyftinteractive turns metrics into measurable ecommerce growth
Swyftinteractive builds ecommerce growth systems where every channel, from website design to Klaviyo email automation, is connected to metrics that drive real decisions. The team specializes in full-funnel performance, including conversion rate tracking, email engagement analysis, and post-purchase revenue measurement. If your current setup produces data but not decisions, Swyftinteractive’s ecommerce website checklist is a practical starting point for identifying where your metrics and your growth systems need to align.
FAQ
What is the main reason to use performance metrics?
Performance metrics connect daily business activity to strategic goals, enabling leaders to make faster, evidence-based decisions. Structured KPI measurement accounts for up to 62.3% of organizational effectiveness.
Which marketing KPIs matter most in 2026?
Lead quality (39.4%), conversion rates (33.9%), and ROMI (31.1%) are the metrics top marketing teams prioritize because they connect directly to revenue rather than activity.
How many KPIs should a business track?
Five to seven core KPIs is the most effective range for most organizations. Tracking more creates decision fatigue and reduces the likelihood that any single metric drives a clear response.
What is the difference between leading and lagging indicators?
Leading indicators predict future performance, such as pipeline velocity or lead quality scores. Lagging indicators confirm past results, such as revenue or churn rate. Effective metric programs use both.
How do you know if your metrics are actually driving growth?
Holdout tests and controlled experiments measure true incremental impact. If your metrics improve while total revenue stays flat, optimization may be masking stagnation rather than driving real growth.