
Fast-loading websites increase conversions, reduce bounce rates, and improve search visibility — often with measurable revenue impact from fractions of a second. A 0.1-second improvement in mobile site speed raised retail conversions by 8% and travel conversions by 10% on average across 37 brands in a Google-commissioned analysis. Google’s Core Web Vitals (LCP, INP, CLS) are now direct ranking signals, which means speed is simultaneously a UX problem, an SEO problem, and a revenue problem.
Top three business impacts of site speed:
- User experience: Slow pages trigger measurable stress responses and drive abandonment before users ever see your product.
- SEO ranking signals: Core Web Vitals feed Google’s Page Experience signal, affecting where your pages rank in mobile-first search results.
- Conversions and revenue: Every small delay in site speed correlates with a drop in conversion rate on Shopify stores.
Over half of mobile visitors abandon a page that takes longer than three seconds to load.
Table of Contents
- What do “site speed” and “page speed” actually mean?
- Why fast-loading websites matter: UX, SEO, and conversions
- What actually slows your pages down?
- How to measure site speed: the right tools for marketers
- High-impact fixes to request from your development team
- How long do fixes take and what do they cost?
- Where should marketing teams focus first?
- Key Takeaways
- When should you hire an agency vs. handle speed fixes in-house?
- Authoritative resources to bookmark and run now
- FAQ
- Speed is the one fix that pays every other fix forward
What do “site speed” and “page speed” actually mean?
These two terms are often used interchangeably, but they measure different things. Page speed is the load performance of a single URL — how fast one specific page renders for a user. Site speed is an aggregate: the average performance across all pages, often reported in Google Analytics or Search Console. Both matter, but for prioritization purposes, page-level data is more useful because it tells you exactly which URLs are hurting your metrics.
Google’s Core Web Vitals are the three field-based metrics that feed directly into ranking signals:
- LCP (Largest Contentful Paint): How long until the main content element loads. Google’s threshold: ≤ 2.5 seconds is “good,” above 4 seconds is “poor.”
- INP (Interaction to Next Paint): How quickly the page responds to user input. Good: under 200 ms. Poor: above 500 ms.
- CLS (Cumulative Layout Shift): Visual stability — how much page elements shift unexpectedly. Good: below 0.1.
Beyond Core Web Vitals, a few supporting metrics help diagnose root causes:
| Metric | What it measures | Why marketers care |
|---|---|---|
| TTFB (Time to First Byte) | Server response time | Slow TTFB usually means hosting or backend issues |
| FCP (First Contentful Paint) | When first content appears | Affects perceived load speed and user patience |
| TBT (Total Blocking Time) | JS blocking the main thread | Linked to poor INP; often caused by third-party scripts |
| TTI (Time to Interactive) | When page is fully usable | Checkout and form pages are most sensitive here |
A home page with a large hero image will usually fail LCP first. A product page with many review widgets and tracking pixels tends to fail INP and TBT. A checkout page with layout shifts from dynamically loaded payment fields will fail CLS. Knowing which metric fails on which page type is how you write a useful developer ticket.
Why fast-loading websites matter: UX, SEO, and conversions
The user experience case
Slow pages don’t just frustrate users — Google research shows the stress response to latency is intense enough to drive abandonment before users even see the content they came for. In the U.S., latency is the number-one reason consumers abandon mobile sites. A delay in load time correlates with a substantial decrease in session length for mobile users, according to Akamai’s retail performance research. That’s not a small rounding error — it’s half your engaged audience walking out the door.

A significant portion of consumers expect a page to load in under two seconds. Most mobile sites don’t come close. The gap between expectation and reality is where bounce rates climb and paid media budgets get wasted sending clicks to a subpar experience.
The SEO case
Core Web Vitals became a confirmed Google ranking factor through the Page Experience update. Google uses field data — real Chrome user sessions — not lab scores, to evaluate your pages. That means a perfect Lighthouse score in a testing tool does not guarantee good rankings if real users on real devices are experiencing slow loads. The Page Experience report in Search Console is the authoritative source for what Google actually sees. Mobile-first indexing compounds this: Google primarily crawls and ranks the mobile version of your site, so a fast desktop experience with a slow mobile one still hurts your rankings.
The conversion and revenue case
The numbers here are specific enough to build a business case from. Akamai’s retail analysis found a 100-millisecond delay hurt conversion rates by up to 7% on smartphones. Desktop pages hitting optimal load times experience peak conversion rates, with sharper drops as load times increase. Longer delays lead to notable reductions in desktop conversion rates below peak levels.
For eCommerce specifically, Shopify’s enterprise data shows every 100ms of slowdown correlates with roughly a 3.5% conversion drop, and LCP differences of around one second relate to roughly 30% differences in conversion rates across some datasets. At scale, that math turns into real revenue. Walmart and Fanatics saw measurable conversion improvements after reducing site load times. Speed’s role in eCommerce growth is not theoretical — it shows up in revenue reports.
Statistic callout: A 0.1-second improvement in mobile speed was shown to lift retail conversions and raise average order value in Google’s study across multiple brands.
What actually slows your pages down?
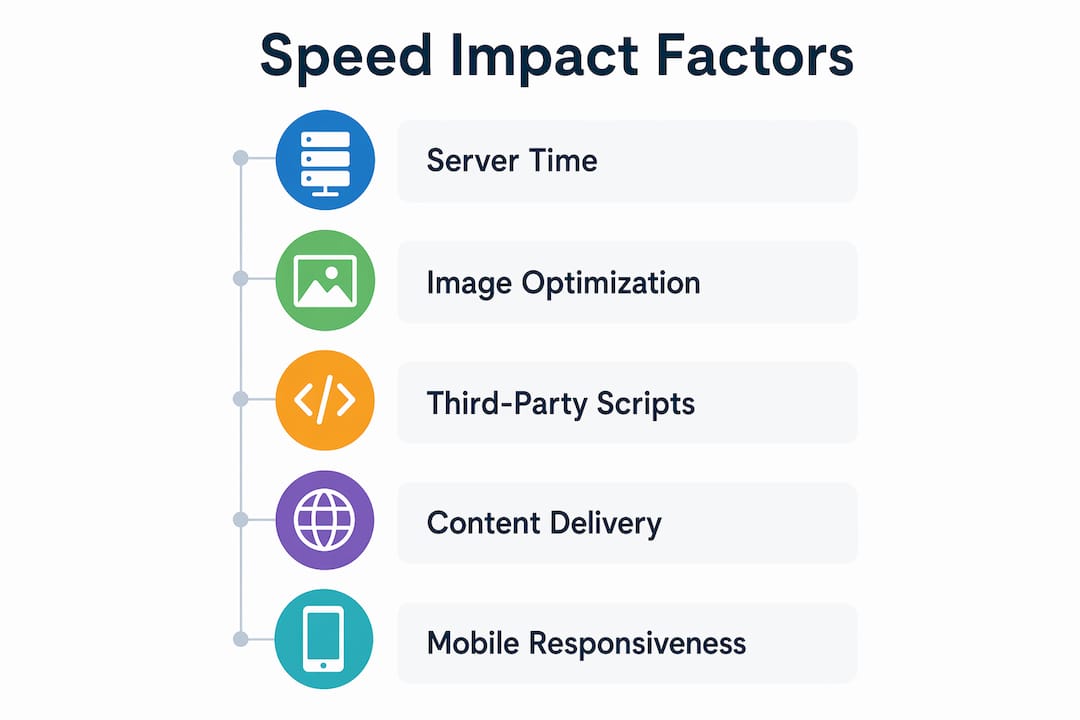
Most slow pages have the same handful of culprits, and marketing decisions cause more of them than most teams realize.
Common technical causes:
- Oversized or uncompressed images (images account for roughly 78% of a page’s total size on average)
- Unoptimized video files served without lazy loading
- Slow server response (high TTFB from shared hosting or no CDN)
- Heavy JavaScript that blocks the main thread
- Lack of browser caching or server-side caching
- Excessive redirects adding round-trip latency
- No content delivery network (CDN) for static assets
Marketing-driven causes (often overlooked):
- Large, uncompressed hero images uploaded directly from design files
- Multiple tracking pixels firing on page load (Meta, Google Ads, TikTok, Hotjar, etc.)
- Page-builder plugins that generate bloated HTML and inline CSS
- A/B testing frameworks that inject JavaScript before the page renders
- Embedded third-party widgets (reviews, chat, loyalty apps) without deferred loading
Marketing decisions frequently drive poor Core Web Vitals — and that means marketers share responsibility for fixing them. The design choices that make a page look great can also be the ones tanking its LCP.
Pro Tip: Before filing a developer ticket, open Chrome DevTools > Network tab and filter by image size. If any single image exceeds 500KB, that’s your first fix. Then check the Performance tab for third-party scripts firing on load — those are usually marketing tags you control directly.
Quick marketer triage checklist:
- Are hero images exported at 2x resolution without compression? (Marketing content issue)
- Are more than three third-party scripts loading synchronously? (Tag management issue)
- Is the page built on a drag-and-drop page builder? (Platform issue — needs developer)
- Is TTFB above 600ms? (Hosting or server issue — needs infrastructure review)
How to measure site speed: the right tools for marketers
Five tools cover the full range of what marketing and development teams need. Each serves a different purpose.
- Google PageSpeed Insights (PSI): Combines field data from the Chrome UX Report with a Lighthouse lab run. Best starting point for any marketer — shows real-user Core Web Vitals alongside diagnostic suggestions. Free.
- Lighthouse: Google’s open-source lab tool, built into Chrome DevTools. Runs locally or via PSI. Best for developers diagnosing root causes; gives detailed opportunity and diagnostic breakdowns. Free.
- WebPageTest: Detailed waterfall charts, filmstrip view of how a page loads visually, and multi-location testing. Best for identifying exactly which resource is blocking load. Free with advanced paid options.
- GTmetrix: Developer-friendly reports combining Lighthouse and WebPageTest data with historical tracking. Good for monitoring trends over time and sharing reports with clients or stakeholders. Free tier available; paid plans add monitoring.
- BrowserStack: Cross-device and cross-browser visual testing on real devices. Best for validating that speed and layout hold up on actual iOS and Android hardware, not just emulators. Paid.
| Tool | Metrics reported | Diagnostic depth | Mobile testing | Best for | Free tier |
|---|---|---|---|---|---|
| PageSpeed Insights | LCP, INP, CLS, FCP, TTFB | High-level + lab | Yes (field + lab) | Marketers, first check | Yes |
| Lighthouse | LCP, INP, CLS, TBT, TTI | Root-cause | Simulated | Developers | Yes |
| WebPageTest | LCP, CLS, TTFB, waterfall | Root-cause | Yes (real devices) | Developers | Yes |
| GTmetrix | LCP, CLS, TBT, waterfall | Medium | Simulated | Both | Yes (limited) |
| BrowserStack | Visual rendering, layout | Visual/UX | Real devices | QA, cross-device | No |
Quick run checklist for a repeatable speed audit:
- Open Google Search Console > Experience > Page Experience. Note which URLs are failing Core Web Vitals in the field.
- Paste the failing URL into PageSpeed Insights. Record LCP, INP, and CLS scores for both mobile and desktop.
- Run the same URL in WebPageTest (use a U.S. test location, cable connection setting). Review the waterfall for the largest blocking resources.
- Run Lighthouse in Chrome DevTools for root-cause diagnostics and specific “Opportunities” to share with developers.
- Capture screenshots of all scores and export the WebPageTest filmstrip. Package these into a developer ticket with specific metrics and URLs.
Pro Tip: Search Console’s Page Experience report uses field data — the same signal Google uses for ranking. Always start there, not with a lab tool. A lab score is a diagnostic; field data is the verdict.
High-impact fixes to request from your development team
Prioritize by effort-to-impact ratio. The fixes below are ordered from lowest effort to highest, with the largest gains at the top.
- Compress and resize images — Convert to WebP or AVIF, resize to display dimensions, and compress to under 150KB for hero images. Largest single gain for most sites.
- Enable lazy loading for offscreen media — Add
loading="lazy"to images and iframes below the fold. Zero visual impact; meaningful LCP improvement. - Implement a CDN — Serve static assets from a content delivery network close to the user. Reduces TTFB and asset load time globally.
- Enable browser and server caching — Set appropriate cache headers so returning visitors load pages from local storage, not the server.
- Audit and defer third-party scripts — Move non-critical tags (chat widgets, review apps, analytics beyond GA4) to load after the main content. Use Google Tag Manager’s trigger sequencing to control firing order.
- Defer noncritical JavaScript — Add
deferorasyncattributes to scripts that don’t need to run before the page renders. - Inline critical CSS — Extract the CSS needed to render above-the-fold content and inline it in the
<head>. Eliminates a render-blocking request. - Add preconnect hints for key third parties —
<link rel="preconnect">for Google Fonts, CDN domains, and analytics endpoints cuts connection setup time. - Reduce redirects — Each redirect adds a full round-trip. Audit your URL structure and eliminate chains (e.g., HTTP > HTTPS > www > non-www).
| Fix | Effort | Typical impact |
|---|---|---|
| Image compression and format conversion | Low | High (LCP, page weight) |
| Lazy loading offscreen images | Low | Medium (LCP, bandwidth) |
| CDN implementation | Low–Medium | High (TTFB, global load) |
| Browser/server caching | Low | Medium (repeat visit speed) |
| Third-party script deferral | Medium | High (INP, TBT) |
| Defer/async JavaScript | Medium | Medium (TBT, TTI) |
| Critical CSS inlining | Medium | Medium (FCP, LCP) |
| Redirect reduction | Low | Low–Medium (TTFB) |
| Theme or architecture rewrite | High | Very high (all metrics) |
For a full optimization checklist, Swyftinteractive’s website optimization checklist for marketers covers these steps with CMS-specific guidance.

How long do fixes take and what do they cost?
Quick wins (1–5 days, low cost):
- Image compression and format conversion: a developer or even a marketer with Squoosh or Cloudinary can complete this in hours; no code changes required.
- Enabling caching headers and a CDN (Cloudflare’s free tier covers most small-to-mid stores): typically a half-day configuration task.
- Lazy loading: a one-line HTML attribute change or a CMS plugin toggle.
Medium-effort work (1–4 weeks, moderate cost):
- Third-party script audit and tag governance: requires a Tag Manager review, stakeholder alignment on which tools to keep, and testing. Plan for one to two weeks.
- JavaScript deferral and critical CSS: a developer task requiring careful testing to avoid visual regressions. Budget three to five days of developer time.
- Redirect cleanup: depends on site size; a mid-size eCommerce store might take a week to audit and implement.
Larger projects (1–3 months, higher investment):
- Theme or template rewrite: necessary when a page-builder-based site has accumulated too much technical debt to patch incrementally. Scope varies widely by platform and complexity.
- Architecture changes (new hosting stack, edge rendering, image CDN pipeline): enterprise-level work requiring dedicated engineering time.
The fastest revenue return comes from image optimization and CDN setup. Both are low-cost, low-risk, and show measurable LCP improvement within days. Pair that with a third-party script audit and most sites see meaningful Core Web Vitals gains before touching a line of application code. For deeper eCommerce conversion optimization, speed fixes are the foundation everything else builds on.
Where should marketing teams focus first?
Not every page deserves equal attention. The highest-value targets are the pages where traffic volume meets purchase intent: product detail pages, checkout, and primary paid-media landing pages. A slow checkout page costs more per session than a slow blog post.
Prioritization checklist:
- Pull your top 20 URLs by organic traffic from Google Search Console.
- Cross-reference with conversion data from Google Analytics 4 to identify pages with both high traffic and high conversion value.
- Check each URL’s Core Web Vitals status in the Page Experience report. Flag any “Poor” or “Needs Improvement” URLs in that top-20 list.
- Rank by: (traffic × conversion rate × revenue per conversion). Fix the top of that list first.
How to use Search Console effectively:
- Go to Search Console > Experience > Core Web Vitals.
- Click “Open Report” for mobile (mobile-first indexing means mobile field data is what Google uses).
- Export the list of “Poor” URLs. These are your developer tickets.
- After fixes deploy, monitor the same report for status changes — Google typically updates field data within 28 days of a change.
Performance is a cross-functional business metric, not a purely technical one. Marketing owns the content decisions that affect LCP (hero images, above-the-fold video). Development owns the infrastructure. Both teams need to be in the same prioritization conversation.
When to bring in an agency: If your in-house team lacks the bandwidth to run a full audit, or if the site is built on a complex custom theme with significant technical debt, an agency engagement makes sense. Swyftinteractive builds high-converting eCommerce websites with speed baked into the architecture from the start, rather than patched on afterward.
Key Takeaways
Fast-loading websites are a measurable revenue driver: a 0.1-second improvement in mobile speed correlated with increases in retail conversion rates and average order value in Google’s analysis of 37 brands.
| Point | Details |
|---|---|
| Speed is a ranking signal | Core Web Vitals (LCP ≤ 2.5s, INP < 200ms, CLS < 0.1) feed Google’s Page Experience ranking factor directly. |
| Conversions drop fast with delay | A 100ms delay correlates with up to a 7% conversion drop on mobile; a two-second delay can cut conversions by nearly 37%. |
| Images are the biggest quick win | Images account for roughly 78% of average page weight — compress and convert to WebP first. |
| Field data beats lab scores | Search Console’s Page Experience report uses real Chrome user data, the same signal Google ranks with. |
| Prioritize by traffic and revenue | Fix product pages, checkout, and paid landing pages first — that’s where speed gains translate directly to revenue. |
Stakeholder pitch: Site speed is a revenue KPI. Google’s own research across 37 brands found that a 0.1-second improvement in mobile load time lifted both retail conversions and average order value. Our highest-traffic product pages and checkout currently score on mobile. Fixing image compression, adding a CDN, and deferring third-party scripts are low-cost changes that typically show measurable Core Web Vitals improvements within 28 days. We should prioritize these before the next paid media push.
When should you hire an agency vs. handle speed fixes in-house?
The honest answer depends on four factors: platform complexity, technical debt, in-house bandwidth, and how much revenue is at stake per month of delay.
Handle in-house when: your team has a developer available, the site runs on a standard platform (Shopify, WordPress with a maintained theme), and the issues are image-related or tag-management-related. These are solvable without deep engineering.
Bring in an agency when: the site is on a custom theme with years of accumulated code, Core Web Vitals are failing across dozens of URLs, or the team has tried incremental fixes without moving the needle. At that point, a structured audit and prioritized backlog from an outside team pays for itself quickly.
What to include in an agency brief:
- Target URLs (top 10–20 by traffic and conversion value)
- Current Core Web Vitals scores (screenshots from PSI and Search Console)
- Business KPIs: conversion rate, revenue per session, paid media spend hitting affected pages
- Access to Google Analytics 4, Search Console, and Tag Manager
- Timeline constraints (upcoming campaigns, product launches)
- Budget range and whether implementation or audit-only is needed
Ask any agency you’re evaluating to deliver: a full site audit with prioritized fix backlog, before/after measurement plan, implementation scope, and a monitoring cadence for the 28-day field data update cycle. SLAs on Core Web Vitals improvement (e.g., moving from “Poor” to “Good” on target URLs within 60 days) are reasonable to request.
Swyftinteractive’s eCommerce website design and conversion service combines speed-optimized development with conversion rate strategy — so performance improvements translate directly into revenue, not just better scores in a testing tool.
Authoritative resources to bookmark and run now
- Google Search Central: Core Web Vitals — Official thresholds, ranking guidance, and how field data feeds Page Experience. Start here for any stakeholder conversation about SEO impact.
- Google PageSpeed Insights — Run any URL for instant field + lab data. Free, no account required.
- Lighthouse — Built into Chrome DevTools (F12 > Lighthouse tab). Best for root-cause diagnostics before writing developer tickets.
- WebPageTest — Waterfall charts and filmstrip view for identifying exactly which resource is blocking load. Free.
- GTmetrix — Historical tracking and shareable reports; useful for monitoring progress after fixes deploy.
- BrowserStack — Real-device testing across iOS and Android. Essential before any major launch.
- Think with Google: Milliseconds Make Millions — The primary research source for mobile speed’s impact on conversions and revenue. Worth sharing with any stakeholder who needs convincing.
- Google Search Console > Page Experience — Save this as your single source of truth for field-based ranking signals. Check it monthly and after any major site change.
- Swyftinteractive — For teams that want an agency to handle audit, prioritization, and implementation end-to-end.
FAQ
Why is website loading speed important?
Speed directly affects user behavior, search rankings, and revenue. 53% of mobile users leave a page that takes more than three seconds to load, and Core Web Vitals are a confirmed Google ranking signal — meaning slow pages lose both traffic and conversions simultaneously.
What is the 3-second rule in web design?
The 3-second rule refers to the widely cited threshold at which mobile users abandon a page. Akamai’s retail research confirmed that 53% of mobile visitors leave if a page takes longer than three seconds, making sub-3-second load times the practical minimum for retaining mobile traffic.
What is a good load speed for a website?
For peak conversions, slower load times correlate with notable drops in conversion rates on desktop and mobile. Google’s Core Web Vitals set LCP (the main content load time) at ≤ 2.5 seconds as “good.” Aim for LCP under 2.5 seconds and a full page load under 3 seconds on mobile.
How does site speed affect SEO rankings?
Google uses Core Web Vitals field data from real Chrome sessions as a Page Experience ranking signal. Pages that score “Poor” on LCP, INP, or CLS can rank lower than comparable pages with better scores, particularly in competitive mobile search results.
Which pages should I fix first for the biggest revenue impact?
Prioritize product detail pages, checkout, and primary paid-media landing pages. These combine high traffic with high purchase intent, so speed improvements there translate directly into conversion gains rather than just engagement metrics.
Speed is the one fix that pays every other fix forward
Here’s the thing most marketing teams miss: speed work isn’t a one-time project. Every new campaign asset, every additional tracking pixel, every plugin added to the CMS is a potential regression. The brands that win on speed treat it as an ongoing KPI with the same rigor they apply to conversion rate or ROAS.
The evidence is clear enough that the debate shouldn’t be whether to prioritize speed — it should be which pages to fix this sprint. Start with Search Console’s Page Experience report, identify your worst-performing high-revenue URLs, and compress your images before you do anything else. That alone moves the needle for most sites. Everything after that is incremental, measurable, and worth doing.