

Revenue per email (RPE), also called revenue per recipient (RPR), is the single number that tells you how much money each email you send actually earns. The formula is straightforward: RPE = attributed revenue ÷ emails sent. If a campaign generates $12,000 in attributed revenue from 10,000 sends, your RPE is $1.20. That one number tells you more about email performance than open rate ever will.
Three quick orientation points before you calculate:
- Use RPE (per send) for broadcast campaigns where volume and frequency matter most.
- Use RPR (per unique recipient) for flows, where the same person may receive multiple messages and you want a clean per-person view.
- Act on the number immediately: a strong RPE confirms you should send more; a weak one signals you need to investigate attribution, segmentation, or offer quality before scaling.
Pro Tip: Calculate RPE at the campaign level and RPR at the flow level from day one. Blending them into a single account-wide number hides the signals you need to act on.
As DashThis defines it, RPE is attributed revenue divided by emails sent or recipients — a clean, operational metric that belongs in every ecommerce reporting stack.
Key Takeaways
Accurate RPE measurement requires consistent attribution windows, net revenue figures, and separate reporting for campaigns and flows.
| Point | Details |
|---|---|
| RPE is the core email revenue metric | Calculate as attributed net revenue ÷ emails sent; use RPR (per unique recipient) for flows. |
| Flows outperform campaigns by a wide margin | Klaviyo benchmarks show a median of $0.11 RPR for campaigns vs. $1.94 for automated flows. |
| Net revenue, not ESP gross | Always subtract refunds and chargebacks before computing RPE; ESP-reported figures are gross by default. |
| Consistent attribution windows are non-negotiable | A click-based 24–72 hour window is the most defensible; document it and apply it uniformly every period. |
| Swyftinteractive audits and fixes measurement gaps | Klaviyo lifecycle audits, GA4 mapping, and dashboard builds close the gap between reported and net RPE. |
Table of Contents
- What is revenue per email and when should you use it?
- What are the exact formulas and variants you should know?
- How do you decide what revenue to include in the numerator?
- Who counts in the denominator and how do you deduplicate?
- Step-by-step worked examples you can copy
- What measurement mistakes break your RPE numbers?
- What is a good revenue per email benchmark?
- How do you reliably increase revenue per email?
- What should your RPE dashboard include?
- The RPE calculation checklist your team should run every time
- What we see working for ecommerce brands
- Swyftinteractive can set up your RPE measurement and Klaviyo automation
- Sources
- FAQ
What is revenue per email and when should you use it?
RPE and RPR measure the same underlying thing from slightly different angles. RPE divides attributed revenue by every email sent or delivered. RPR divides the same revenue by unique recipients, removing the distortion that comes when one person receives three messages in a flow sequence.

Neither metric replaces conversion rate or average order value (AOV). They work together. Conversion rate tells you what percentage of recipients bought; AOV tells you how much they spent; RPE/RPR tells you the combined output per message. Average revenue per user (ARPU) operates at the customer level across all channels, so it is a different unit of analysis entirely.
Open rate used to anchor email reporting. That era is over. Apple’s Mail Privacy Protection (MPP), rolled out in 2021 and now widespread, pre-fetches email pixels regardless of whether a human opened the message. Prooflytics documents that open-based attribution is now unreliable, and email teams have shifted to revenue metrics, click-through rate, and conversion as primary signals. RPE fits that shift perfectly because it is grounded in actual orders, not pixel fires.
Pro Tip: In Klaviyo, RPR appears natively on campaign detail pages once your ecommerce integration is live. Use it as your default campaign health check instead of open rate.
What are the exact formulas and variants you should know?
Three formulas cover most reporting needs:
- RPE = Attributed revenue ÷ emails sent (or delivered)
- RPR = Attributed revenue ÷ unique recipients
- RPME = (Attributed revenue ÷ emails delivered) × 1,000
RPME (revenue per thousand emails) is useful for executive dashboards where the raw per-email figure looks small and loses meaning. A $0.08 RPE becomes $80 RPME, which reads more naturally alongside CPM-style media metrics.
| Formula | Best use case | Reporting context |
|---|---|---|
| RPE (per send) | Broadcast campaign analysis | Campaign manager, weekly send reports |
| RPR (per recipient) | Flow optimization, lifecycle reporting | Flow analytics, monthly executive summary |
| RPME (per 1,000) | Cross-channel media comparison | CMO dashboard, paid vs. email benchmarking |
| Blended account RPE | Overall program health | Quarterly business review |
Attribution window variants change the numerator, not the formula. A click-based 24-hour window attributes only orders placed within 24 hours of a tracked click. A 72-hour window captures more purchases but also more coincidental ones. Open-based windows are now unreliable post-MPP. Multi-touch models distribute credit across touchpoints, which is more accurate for complex journeys but harder to implement cleanly in most ESPs.
Worked example — campaign vs. flow:
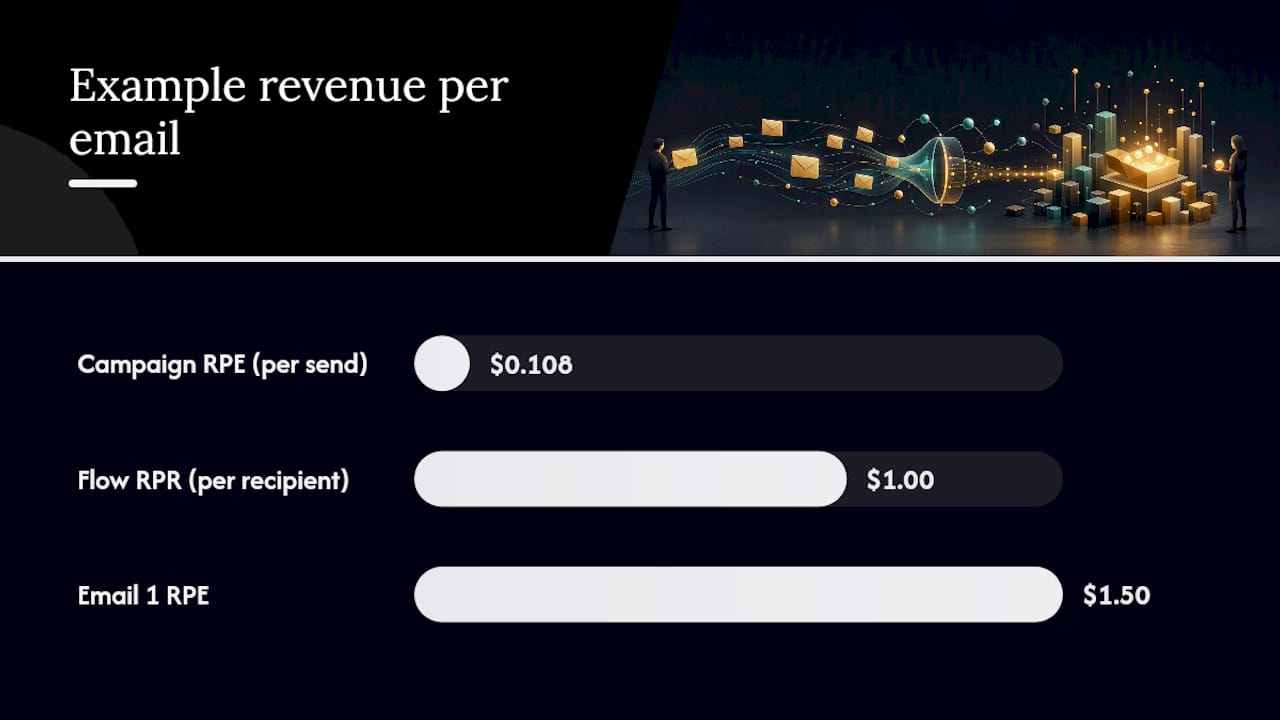
- Promotional campaign: 25,000 emails sent, 18 orders, $2,700 attributed revenue. RPE = $2,700 ÷ 25,000 = $0.108.
- 3-email abandoned cart flow: 3,000 unique recipients entered the flow. Email 1 drove $1,800, Email 2 drove $900, Email 3 drove $300. Total flow revenue = $3,000. Flow RPR = $3,000 ÷ 3,000 = $1.00. Per-email RPE for Email 1 alone (1,200 sends) = $1,800 ÷ 1,200 = $1.50.
The flow RPR is significantly higher than the campaign RPE. That gap is why Klaviyo recommends separating campaign and flow RPR when reporting rather than averaging them together.
Pro Tip: Run RPME when presenting to finance or leadership who are accustomed to media buying metrics. It translates email performance into a language they already use.
How do you decide what revenue to include in the numerator?
Getting the numerator right is where most teams make their first mistake. The choice of attribution model and revenue source determines whether your RPE reflects reality or a flattering fiction.
Attribution model options:
- Click-window (24–72 hours): Attributes revenue from orders placed within the window after a tracked click. This is the most defensible approach for email because it ties purchase intent directly to a click action. Prooflytics recommends click-attributed windows of 24–72 hours specifically because MPP has made open-based attribution unreliable.
- Open-based windows: Now problematic. MPP pre-fetches open pixels, inflating open counts and any revenue attributed to opens.
- Multi-touch (linear, time-decay, position-based): Distributes credit across email, paid, organic, and direct touchpoints. More accurate for understanding true email contribution in complex journeys, but requires GA4 or a dedicated attribution tool to implement.
What to include and exclude:
- Include: Net product revenue from orders attributed within your window.
- Exclude: Shipping fees, taxes, and gift wrapping (these inflate RPE without reflecting marketing performance). Refunds and chargebacks must be netted out.
ESP-reported revenue is gross by default. Klaviyo, for example, reports revenue based on placed orders within its attribution window, without automatically deducting returns. Your payment processor or accounting system (Stripe, QuickBooks) holds the net figure.
Integration priority checklist:
- Connect Klaviyo to your ecommerce platform (Shopify, BigCommerce, WooCommerce) so order data flows natively.
- Export attributed orders from Klaviyo with order IDs.
- Match order IDs against your payment processor export to net refunds.
- Pull GA4 for multi-channel journeys where email is one of several touchpoints.
- Document the attribution window you used and store it with the report.
Pro Tip: Shopify Email’s default attribution window runs up to 30 days after a click, which can significantly inflate apparent email contribution. If you are comparing Shopify Email reporting to Klaviyo’s shorter windows, you are not comparing the same metric.
One important note on window consistency: whatever window you choose, apply it uniformly across all campaigns and flows in a reporting period. Mixing a 24-hour window for one campaign and a 72-hour window for another makes period-over-period comparison meaningless.
Who counts in the denominator and how do you deduplicate?
The denominator choice is quieter than the numerator debate, but it shapes the metric just as much.
- Emails sent: Every message that left your ESP, including those that bounced. This is the most conservative denominator and produces the lowest RPE.
- Emails delivered: Sent minus hard and soft bounces. A cleaner measure of actual inbox reach.
- Unique recipients: Each person counted once, regardless of how many messages they received. This is the right denominator for flows.
For a broadcast campaign sent once to a list, “delivered” and “unique recipients” are nearly identical. For a 5-email welcome series, they diverge sharply. A recipient who received all five emails counts as 5 in the “delivered” denominator but as 1 in the “unique recipients” denominator. Flow RPR uses unique recipients; that is the only way to answer “how much revenue did this flow generate per person who entered it?”
Deduplication rules:
- For RPR at the flow level, count each person who entered the flow once, regardless of how many emails they received.
- For RPE at the individual email level within a flow, use the delivered count for that specific message.
- Suppressed addresses (unsubscribes, hard bounces, complaint-flagged) should be excluded from the denominator once suppressed. Including them deflates RPE and misrepresents deliverable list performance.
List cleaning has a direct effect on RPE. Removing chronic non-engagers and invalid addresses shrinks the denominator, which raises RPE even if attributed revenue stays flat. That is not gaming the metric; it reflects the actual performance of your deliverable list. Count on time-period variants reinforces that consistent denominator definitions across monthly and annual calculations are what make trend analysis reliable.
Pro Tip: Prefer RPR for flows and RPE for high-volume newsletters. The distinction keeps your optimization signals clean: flow RPR tells you whether the sequence is worth running; campaign RPE tells you whether the send frequency is justified.
Step-by-step worked examples you can copy
Campaign-level RPE
- Pull attributed revenue from Klaviyo for the campaign: $4,500.
- Pull delivered count: 40,000.
- Net refunds from payment processor: $300 in returns on email-attributed orders.
- Net revenue: $4,200.
- RPE = $4,200 ÷ 40,000 = $0.105.
- Interpretation: slightly below the campaign median of $0.11 — worth investigating subject line, offer, or segment quality.
3-email abandoned cart flow RPR
- Unique recipients who entered the flow: 2,500.
- Email 1 attributed revenue (net): $2,800.
- Email 2 attributed revenue (net): $1,100.
- Email 3 attributed revenue (net): $400.
- Total flow net revenue: $4,300.
- Flow RPR = $4,300 ÷ 2,500 = $1.72.
- Per-email RPE for Email 1 (2,500 delivered): $2,800 ÷ 2,500 = $1.12.
Monthly per-recipient aggregation
- List all campaigns and flows active in the month.
- Sum net attributed revenue across all: $38,000.
- Count unique recipients who received at least one email during the month: 22,000.
- Monthly RPR = $38,000 ÷ 22,000 = $1.73.
| Example | Sends / Recipients | Net Revenue | RPE / RPR |
|---|---|---|---|
| Promotional campaign | 40,000 delivered | $4,200 | $0.105 RPE |
| Abandoned cart flow | 2,500 recipients | $4,300 | $1.72 RPR |
| Monthly program | 22,000 recipients | $38,000 | $1.73 RPR |
What measurement mistakes break your RPE numbers?
The most common mistakes:
- Mismatched time periods: Pulling ESP revenue for March 1–31 but payment-processor data for March 3–April 2 because of processing delays. Always align windows to the same calendar dates.
- Including non-email revenue: If your attribution window is wide (30 days) and your email list is large, some orders will be attributed to email that would have happened anyway. Tighter windows reduce this noise.
- Not netting refunds: ESP-reported revenue is gross. A brand with a 15% return rate that never nets refunds is overstating RPE by a meaningful margin.
- Double-counting across channels: A customer who clicked an email and then a Google ad may be attributed in both Klaviyo and GA4. Without deduplication rules, you are counting the same order twice.
The reconciliation rule that fixes most drift: Export attributed orders from your ESP with order IDs. Match those IDs against your payment processor export. Net refunds at the order level. The difference between your ESP’s gross revenue figure and this net number is your reconciliation gap. Document it every reporting period. If it grows, something changed in your attribution setup.
Data-quality checklist:
- UTM parameters on every email link, consistent naming convention (utm_source=klaviyo, utm_medium=email, utm_campaign=[campaign-name]).
- Order ID matching between ESP and payment processor exports.
- Attribution window documented and fixed for the reporting period.
- Reconciliation run at least monthly; quarterly at minimum for smaller programs.
- Suppressed addresses removed from denominator before calculating.
Pro Tip: Set a calendar reminder for the 5th of each month to run your ESP-vs-payment-processor reconciliation. Catching drift early takes 30 minutes; catching it after six months of compounding errors takes days.
What is a good revenue per email benchmark?
The honest answer: it depends on your email type, vertical, and AOV. But there are useful anchors.
Klaviyo-backed benchmarks across 183,000+ brands show a median RPR of $0.11 for campaigns and $1.94 for automated flows.
Broadcast campaigns typically run $0.05–$0.25 per email. Welcome series and abandoned cart flows often reach $0.80–$3.65+, depending on AOV and how well the flow is configured.
What drives variance:
- AOV: A $300 average order value produces higher RPE than a $30 one, all else equal. Always interpret RPE relative to your own AOV, not a cross-industry average.
- List quality: A clean, engaged list of 20,000 subscribers will outperform a bloated, unengaged list of 100,000 on RPE every time.
- Vertical: Fashion and beauty tend toward higher send frequency and lower per-email revenue. Outdoor, home, and electronics tend toward lower frequency and higher per-email revenue.
Axis Intelligence reports that automated flows account for 41% of email revenue while representing only 5.3% of sends in Klaviyo’s dataset. That concentration is the clearest argument for measuring flows separately and investing in their optimization first.
If your RPE falls below benchmarks, check these in order:
- Deliverability: are your emails reaching the inbox? Low inbox placement suppresses revenue regardless of offer quality.
- Segmentation: are you sending the right offer to the right cohort? Broad sends to unengaged segments drag RPE down.
- Offer quality: does the email give the recipient a clear, compelling reason to buy now?
- Attribution setup: is your window too narrow to capture your typical purchase cycle?
How do you reliably increase revenue per email?
Fix the measurement first. Optimizing a metric you cannot trust produces confident decisions based on bad data. Once your attribution is clean, work through this prioritized checklist.
Implementation order:
- Fix attribution and reporting. Confirm UTMs are live, ESP is integrated with your ecommerce platform, and you have a reconciliation process in place.
- Optimize flows. Abandoned cart, welcome series, and post-purchase flows generate the highest RPR. Audit each for timing, copy, and offer. Email automation for ecommerce is where most brands find their fastest RPE gains.
- Segment high-value cohorts. Separate your VIP buyers, recent purchasers, and lapsed customers. Send each group a message calibrated to their position in the lifecycle. Segmentation in ecommerce email consistently lifts RPE by narrowing the audience to those most likely to convert.
- Test conversion elements. Subject line tests affect open rate, not directly RPE. Test offer structure (discount vs. free shipping vs. bundle), CTA placement, and product selection instead. These tests move revenue, not just clicks.
- Clean your list and re-engage. Suppress chronic non-engagers. Run a sunset flow before suppressing. A smaller, engaged list produces higher RPE than a large, unengaged one.
Deliverability actions that unlock RPE gains:
- Authenticate your sending domain with SPF, DKIM, and DMARC records.
- Monitor inbox placement with a tool like Google Postmaster Tools.
- Keep complaint rates below 0.08% (Google’s published threshold for Gmail).
- Warm new sending domains gradually before scaling volume.
Pro Tip: For revenue-driven A/B tests, you need enough attributed orders to reach statistical significance, not just enough opens. A test that generates fewer than 50 attributed orders per variant is too small to trust. Run it longer or increase the audience size before declaring a winner.
What should your RPE dashboard include?
A dashboard that only shows RPE is incomplete. The metric needs context to be actionable.
Essential fields for every RPE dashboard panel:
- RPE or RPR (campaign and flow, reported separately)
- Attributed revenue (gross and net of refunds)
- Emails sent / delivered / unique recipients
- Conversion rate from email (orders ÷ unique clicks or delivered)
- AOV for email-attributed orders
- Refund amount and refund rate on attributed orders
- Net revenue reconciliation field (ESP gross minus refunds)
Dashboard views to build:
- Campaign list view: One row per campaign, columns for send date, RPE, attributed revenue, conversion rate, AOV. Sort by RPE descending to surface top performers.
- Flow view: One row per flow, RPR, total attributed revenue, entry count, conversion rate. Flag flows below the $1.94 median benchmark.
- Time-series RPE: Weekly or monthly RPE trend line, overlaid with send volume. Drops in RPE concurrent with volume spikes often signal list fatigue or segmentation issues.
- Cohort comparison: New vs. returning customers, geography, AOV bucket. These filters reveal whether RPE is driven by a specific segment or is broad-based.
That threshold catches real problems without triggering false alarms on normal variance.
Dashboard governance checklist:
- Designate one analytics owner who signs off on the RPE figure each period.
- Document the attribution window and denominator definition in a data dictionary.
- Run the ESP-vs-payment-processor reconciliation before publishing any dashboard.
- Review governance rules quarterly, especially after platform updates that may change default attribution settings.
The RPE calculation checklist your team should run every time
Run this in order, every reporting period, without skipping steps.
- Match time windows. Confirm your ESP export and payment-processor export cover identical calendar dates.
- Choose and document the attribution model. Click-based, 24–72 hour window is the recommended default. Write it down.
- Pull ESP attributed revenue. Export from Klaviyo with order IDs and timestamps.
- Pull payment-processor data. Export orders for the same period from Stripe, Shopify Payments, or your accounting system.
- Net refunds and chargebacks. Match order IDs and subtract returns from gross ESP revenue.
- Deduplicate recipients. For RPR, count each person once. For RPE, use delivered count per message.
- Compute RPE and RPR. Apply the correct formula for each email type.
- Document assumptions. Record the window, denominator choice, and reconciliation gap in your data dictionary.
- Sign off. Analytics owner and email ops lead both confirm the numbers before they go into any report.
Where to store this:
- Keep a calculation log in a shared spreadsheet or your team’s wiki (Notion, Confluence).
- Store one row per reporting period with: date range, attribution window, gross ESP revenue, net revenue, denominator type, final RPE/RPR, and reconciliation gap.
- Review the log quarterly to catch drift in any of these variables.
What we see working for ecommerce brands
The pattern that shows up most often across ecommerce email programs is this: automation is underused, attribution is misconfigured, and open rate is still the metric leadership asks about in weekly reviews.
The attribution misconfiguration is the most expensive problem. Brands running Klaviyo with a 5-day click window and comparing that number to a GA4 last-click report are looking at two different metrics and calling them the same thing. The fix is not complicated: pick one window, document it, and reconcile the two systems monthly. What makes it hard is that nobody owns the reconciliation. It falls between the email team and the analytics team, and both assume the other is handling it.
Flows are the second gap. Most brands have an abandoned cart flow and a welcome series, but they are often configured with default timing and generic copy from the initial setup. A Klaviyo lifecycle audit typically surfaces three to five flow-level fixes that lift RPR without any additional sends. The benefits of email automation compound quickly once flows are properly sequenced and timed.
The third gap is list hygiene. Brands that have never run a sunset flow are sending to a denominator that includes people who have not opened, clicked, or bought in 12+ months. That drags RPE down and hurts deliverability, which drags it down further.
When resources are limited, the priority order is: fix attribution first, then optimize flows, then run creative tests. Creative tests on a broken attribution setup produce confident decisions based on noise.
Swyftinteractive can set up your RPE measurement and Klaviyo automation
Measuring revenue per email accurately requires the right integration between your ESP, ecommerce platform, and analytics stack. Most brands have at least one of those connections misconfigured, and the result is an RPE number that does not reflect actual net revenue.
Swyftinteractive works with ecommerce brands to set up Klaviyo integrations correctly, map GA4 for multi-channel attribution, build RPE dashboards with proper reconciliation fields, and audit existing flows for revenue gaps. The Klaviyo Lifecycle Audit delivers a prioritized action plan: reconciled RPE baseline, flow-by-flow performance review, and a dashboard template your team can maintain going forward. If you want your email revenue numbers to be trustworthy and your flows to perform closer to the $1.94 flow median, book an audit with Swyftinteractive to get a clear picture of where your program stands and what to fix first.
Sources
- What Is Revenue Per Recipient (RPR)? – Klaviyo
- Count
- What is revenue per email and how to calculate it
- Revenue Per Recipient: $1.94 vs $0.11 (2026 RPR)
- Email Marketing Benchmarks 2026: CTR, RPE, and Industry Rates | Prooflytics
- Email Marketing Statistics 2026: ROI, Open Rates, Automation & AI Benchmarks – Axis Intelligence
FAQ
How do you calculate revenue per email?
Divide the net revenue attributed to an email campaign by the number of emails sent or delivered. For flows, divide total flow revenue by unique recipients to get revenue per recipient (RPR).
What is a good revenue per email?
Klaviyo benchmarks across 183,000+ brands show a median of $0.11 per recipient for broadcast campaigns and $1.94 for automated flows. Your target should be set relative to your own AOV and vertical, not a single cross-industry average.
What is the 60/40 rule in email?
It is a copywriting heuristic, not a measurement standard, and it does not directly affect how RPE is calculated.
What is the 30/30/50 rule for cold emails?
It applies to B2B prospecting sequences, not ecommerce broadcast or flow measurement, and has no direct bearing on RPE calculation methodology.
Should I use the same attribution window for campaigns and flows?
Yes. Mixing windows across email types makes period-over-period comparison unreliable. Choose one window (a 24–72 hour click-based window is the most defensible), apply it consistently, and document it in your data dictionary every reporting period.