

TL;DR:
- Improving conversion rates often requires small website and email flow adjustments instead of more traffic.
- Regular measurement and segmentation of key metrics are essential for effective eCommerce optimization.
- Continual testing and tailoring strategies to audience segments lead to sustained conversion growth.
Most eCommerce brands are sitting on a revenue leak they can’t see. Traffic is coming in, ad budgets are burning, and yet the sales numbers don’t reflect the effort. The fix rarely requires more traffic. It requires converting more of what you already have. Small, deliberate changes to your site experience and email flows can move the needle faster than any paid campaign. Klaviyo’s automation data shows that flows generate 25-30% of total email revenue, sometimes delivering up to 30x the revenue per recipient compared to broadcast campaigns. This guide walks you through every step, from measuring your baseline to running smarter experiments.
Table of Contents
- Assessing your current conversion performance
- Optimizing website user experience for higher conversions
- Automating email flows that recover and capture conversions
- Experimenting, measuring, and iterating for lasting gains
- Our take: Why real conversion insights beat ‘best practices’
- Unleash your conversion growth with expert help
- Frequently asked questions
Key Takeaways
| Point | Details |
|---|---|
| Track true conversion drivers | Go beyond conversion rate—monitor revenue per visitor for real progress. |
| Layer automation for compounding results | Strategic email flows like abandoned cart and welcome campaigns can recover 25-30% of lost revenue. |
| Test, don’t assume | Best practices often fail—run your own experiments for lasting improvement. |
| Prioritize key site optimizations | Start with easy, high-impact fixes before complex strategies for quick conversion lifts. |
Assessing your current conversion performance
Before you optimize anything, you need to know where you actually stand. Most teams skip this step and jump straight to tactics, which is why so many CRO efforts produce underwhelming results. Measurement first, action second.
Start by calculating two numbers: your conversion rate (CVR) and your revenue per visitor (RPV). CVR tells you the percentage of visitors who buy. RPV tells you how much each visitor is worth in dollars. Here’s why both matter: you can test RPV not just CVR because a rising CVR paired with a falling average order value (AOV) can actually mean a net revenue loss. That’s a trap many brands fall into.
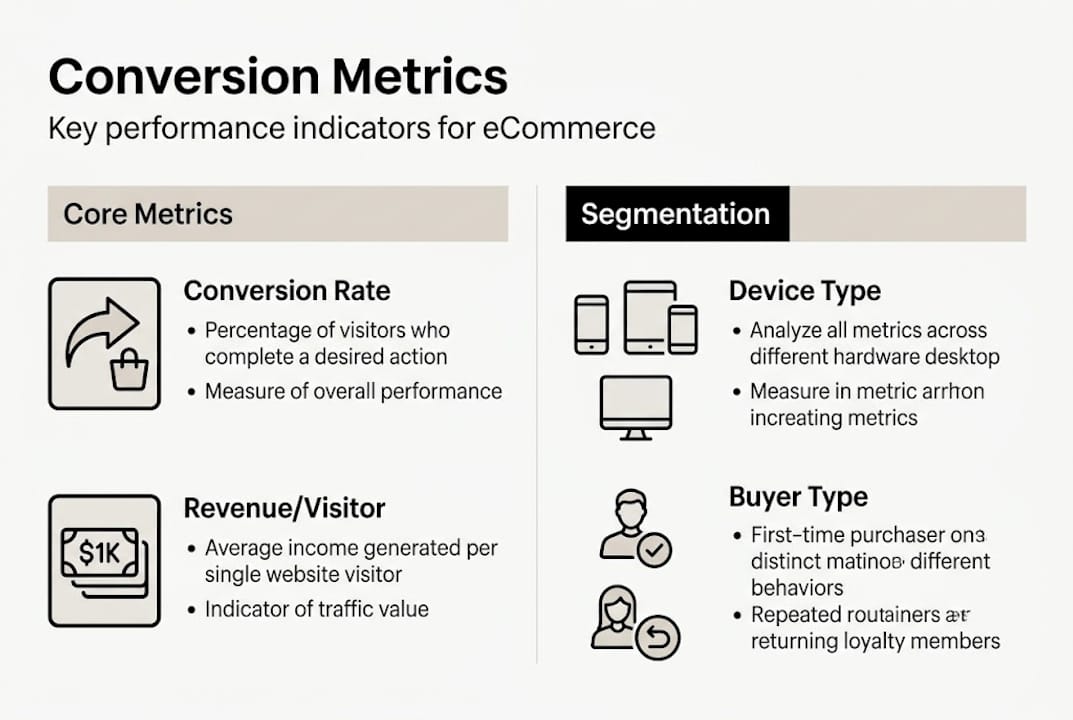
| Metric | Formula | Why it matters |
|---|---|---|
| Conversion rate | Orders / Sessions x 100 | Shows overall funnel health |
| Revenue per visitor | Total revenue / Sessions | Captures AOV impact on growth |
| Cart abandonment rate | 1 minus (Purchases / Add-to-carts) | Flags checkout friction |
| Mobile vs desktop CVR | Segment by device | Reveals UX gaps by device |
Benchmarks are useful as directional signals, not gospel. A 2-4% CVR is often cited as typical, but your category, price point, and audience shape what’s realistic for you. The goal is to know your own number and improve it consistently.
Here are the key metrics to pull before you start any optimization work:
- Overall CVR by channel (organic, paid, email)
- RPV segmented by new vs. returning visitors
- Mobile CVR vs. desktop CVR
- Cart and checkout abandonment rates
- Revenue by customer segment (VIP, first-time, lapsed)
Pro Tip: Most analytics dashboards show blended CVR, which hides the real story. Segment your data by device type and buyer status before drawing any conclusions. A VIP customer converting at 12% and a cold traffic visitor converting at 0.8% should never share the same optimization strategy.
If you want a structured framework for this, the approach to optimize eCommerce conversions starts with exactly this kind of audit. Pairing it with proven conversion optimization strategies gives you a roadmap grounded in real data.
Optimizing website user experience for higher conversions
With a clear baseline in hand, the next move is fixing what’s broken on your site before layering any automation on top. Sending more emails to a leaky funnel just accelerates the drain.
Focus your energy across three core funnel stages: the product page, the cart, and the checkout. Each one has distinct friction points and distinct fixes.
- Product page: Add high-resolution images with zoom, concise benefit-led copy, visible reviews, and a clear, prominent call-to-action button.
- Cart page: Show a progress bar toward free shipping, display trust badges, and offer a one-click upsell or bundle suggestion.
- Checkout: Reduce form fields to the minimum, offer guest checkout, and display security seals near the payment section.
- Site speed: Every one-second delay in load time reduces conversions. Compress images, eliminate render-blocking scripts, and use a CDN.
- Mobile UX: Buttons need to be thumb-friendly, text must be readable without zooming, and the checkout flow needs to feel native on a small screen.
The data on mobile is sobering. Mobile CRO often lags desktop by a significant margin, yet mobile accounts for the majority of eCommerce traffic in most categories. Fixing mobile isn’t optional anymore.

| On-site tactic | Conversion impact | Effort level |
|---|---|---|
| Guest checkout option | High | Low |
| Page speed optimization | High | Medium |
| Mobile UX improvements | High | Medium |
| Trust badges at checkout | Medium | Low |
| Product video on PDP | Medium | Medium |
| A/B test CTA button color | Low-Medium | Low |
Understanding why optimizing your website matters goes beyond aesthetics. It’s about removing every unnecessary decision a buyer has to make. Pair that with smart checkout improvements and you’ll see measurable gains quickly.
Pro Tip: Before running any A/B test, check your conversion rate tips segmented by device. If mobile CVR is less than half your desktop CVR, mobile UX is your highest-priority fix, not copy or color testing.
Automating email flows that recover and capture conversions
Once your site foundations are solid, email automation becomes your most reliable revenue recovery tool. Klaviyo’s native sync with Shopify and WooCommerce means every browse event, cart action, and purchase triggers real-time, behavior-based emails without manual effort.
These are the five flows every eCommerce brand needs active:
- Abandoned cart: Sent 1, 12, and 24 hours after abandonment. Recovers 10-15% of abandoned carts on average.
- Browse abandonment: Targets visitors who viewed products but didn’t add to cart. Catches high-intent shoppers before they forget.
- Welcome series: Introduces your brand and converts new subscribers. Welcome flows average $2.65 revenue per recipient, making them one of the highest-ROI flows you can build.
- Post-purchase: Drives repeat purchases, collects reviews, and builds loyalty in the 7-30 days after a first order.
- Win-back: Re-engages lapsed customers before they churn permanently, often with a time-limited incentive.
Stat: Automated flows consistently generate 25-30% of total email revenue and can deliver up to 30x the revenue per recipient compared to standard broadcast campaigns.
The abandoned cart email guide breaks down exactly how to structure each message for maximum recovery. And if you want a complete setup reference, the Klaviyo automation checklist covers every flow trigger and segment you should have configured.
Pro Tip: Never send the same abandoned cart email to a VIP customer and a first-time visitor. VIPs respond to exclusivity and loyalty recognition. New buyers need social proof and a risk-reducing guarantee. Segment from the start and your recovery rates will reflect it. For deeper loyalty integration, post-purchase automation tips show how to turn one-time buyers into repeat customers.
Experimenting, measuring, and iterating for lasting gains
Automation and site fixes get you a strong foundation. But conversion rates decay. Buyer behavior shifts, competitors improve, and what worked last quarter may underperform today. Consistent testing is what separates brands that sustain gains from those that plateau.
Here’s the uncomfortable truth: best practices fail 40-60% of the time when applied without testing them against your specific audience. A tactic that works brilliantly for a fashion brand may hurt a supplement store. Context always wins.
Structure your experiments this way:
- Form a specific hypothesis: “Adding a money-back guarantee badge to the checkout page will increase CVR by reducing purchase anxiety.”
- Choose one variable: Test one change at a time so you know what caused the result.
- Run parallel tests: Parallel testing is 2-3x faster than sequential testing and accelerates your learning velocity significantly.
- Set a minimum sample size: Never call a test with fewer than 1,000 visitors per variant. Small samples produce false wins.
- Measure RPV, not just CVR: A winning variant that drops AOV can cost you more than it earns.
“Benchmarks are starting points, not finish lines.”
Avoid the trap of declaring victory too early. A CVR lift that disappears after two weeks usually means you caught a seasonal spike, not a real improvement. Run tests long enough to capture at least one full weekly cycle.
For a library of tactics worth testing, proven conversion strategies gives you a prioritized starting list. And if you’re thinking about the bigger picture of optimizing online stores, consistent iteration is the only sustainable path.
Pro Tip: Segment your test results by device and buyer type before reporting. A test that “wins” overall can actually be losing on mobile or among new buyers. Granular analysis prevents bad decisions dressed up as data.
Our take: Why real conversion insights beat ‘best practices’
We’ve worked with enough eCommerce brands to say this plainly: copying what a competitor or case study did rarely produces the same result. Surface-level tactics, like changing a button color or adding urgency timers, can help. But they’re not a strategy.
The brands that consistently grow their conversion rates share one habit. They test everything against their own audience before scaling it. They use benchmarks to contextualize their data, not to set their targets. A 2% CVR might be excellent for a high-ticket furniture brand and terrible for a consumables store.
“If you’re not measuring, you’re guessing, and usually losing.”
The brands we see struggle most are the ones chasing tactics without a measurement system underneath them. They implement five things at once, see a small lift, and don’t know which change caused it. Then they repeat the cycle. Real conversion optimization experiences teach you that patience and precision beat volume of experiments every time. Build the measurement layer first. Then test. Then scale what works for your buyers.
Unleash your conversion growth with expert help
Ready to put these strategies into motion? The steps in this guide work, but implementation speed and accuracy matter. A missed flow trigger or an untested checkout change can cost more than it saves.
Swyft Interactive has built the resources to help you move faster. Start with the comprehensive eCommerce checklist to audit your current setup against every automation and site optimization covered here. Then explore real automation success stories to see how brands like yours have turned Klaviyo flows into consistent revenue engines. If you want to understand the full scope of what’s possible, the breakdown of Klaviyo automation advantages covers every lever available to eCommerce brands today. When you’re ready to scale, we’re here.
Frequently asked questions
What is a good conversion rate for an eCommerce website in 2026?
A typical eCommerce site lands between 2-4% CVR, but benchmarks are starting points, not targets. Focus on improving your own baseline through consistent testing rather than chasing an industry average.
How much revenue can automated email flows recover?
Automated flows like abandoned cart, welcome, and win-back sequences generate 25-30% of total email revenue, with abandoned cart flows alone recovering 10-15% of lost carts on average.
Is it better to run sequential or parallel A/B tests?
Parallel testing runs 2-3x faster than sequential testing, meaning you reach statistical significance sooner and can act on results more quickly.
How do I track conversion improvements accurately?
Always track both CVR and RPV together, since CVR up with AOV down can mean a net revenue loss. Segment results by device, buyer type, and traffic source for a complete picture.