
TL;DR:
- Website speed optimization makes your website load faster by improving server, code, and asset delivery. It relies on real user and controlled lab data, with Core Web Vitals as industry benchmarks. Improving these elements enhances user experience and significantly boosts business revenue and search rankings.
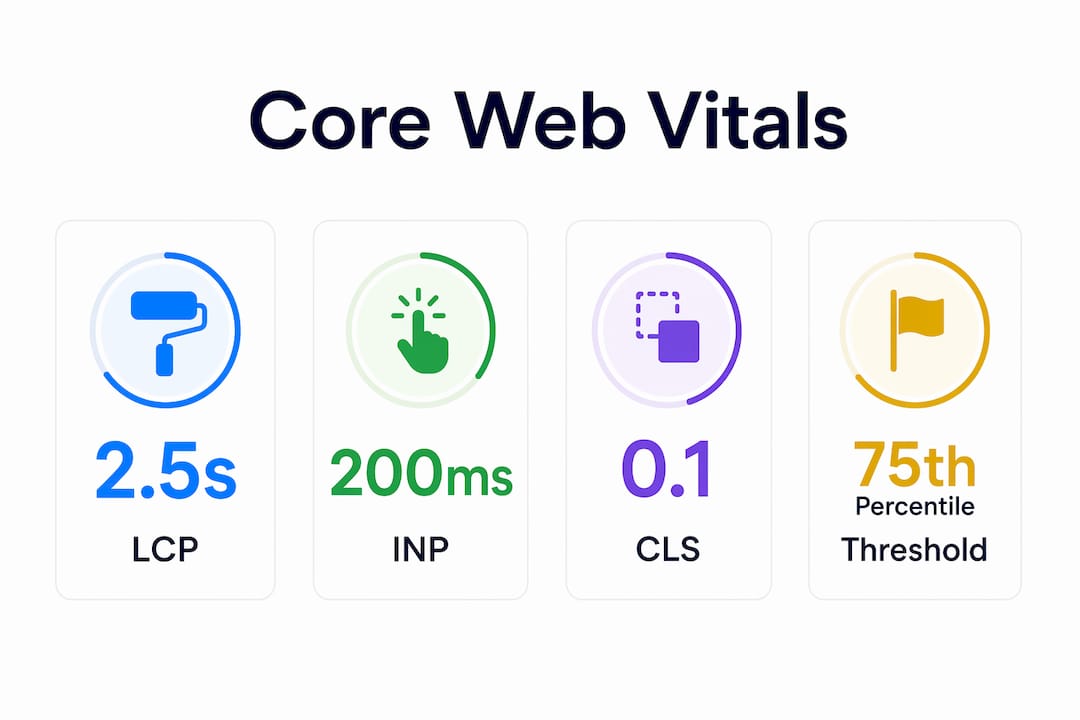
Website speed optimization is the process of making your website load faster and respond more quickly to user interactions by improving server performance, asset delivery, and code efficiency. This practice covers both objective measurements like load time and time to interactive, and perceived experience like visual smoothness and responsiveness. Google’s Core Web Vitals set the industry standard for measuring this: Largest Contentful Paint (LCP) must be 2.5 seconds or less, Interaction to Next Paint (INP) must be 200 milliseconds or less, and Cumulative Layout Shift (CLS) must be 0.1 or less. These thresholds directly affect your search rankings and whether visitors stay or leave. For ecommerce site owners and digital marketers, speed is not a technical detail. It is a revenue lever.
What is website speed optimization and how is it measured?
Website speed optimization covers every change you make to reduce how long your site takes to load and respond. That includes server infrastructure, front-end code, image delivery, and third-party scripts. The industry measures these improvements using two distinct data types: field data and lab data.
Field data comes from real users visiting your site. Google collects this through the Chrome User Experience Report (CrUX), which captures actual load times across millions of visits. Lab data comes from controlled testing tools like Lighthouse, which simulate a page load under fixed conditions. PageSpeed Insights combines both, giving you a real-user baseline alongside diagnostic detail.
The Core Web Vitals thresholds apply at the 75th percentile of real users. That means your site must deliver a good experience to at least three out of four visitors, not just in a single test run. This distinction matters because a lab score of 90 can coexist with a poor field result if your real traffic includes slower devices or connections.
Core Web Vitals at a glance
| Metric | What it measures | Good threshold |
|---|---|---|
| LCP (Largest Contentful Paint) | How fast the main content loads | ≤ 2.5 seconds |
| INP (Interaction to Next Paint) | How fast the page responds to clicks | ≤ 200 milliseconds |
| CLS (Cumulative Layout Shift) | Visual stability during load | ≤ 0.1 |
| TTFB (Time to First Byte) | Server response speed | ≤ 800 milliseconds |
Each metric targets a different part of the user experience. LCP reflects loading speed. INP reflects interactivity. CLS reflects whether content jumps around as the page loads. Fixing all three together produces a measurably better experience for most of your visitors.
What techniques are most effective to improve website speed?
Speed improvements come from changes across three layers: the server, the code, and the assets delivered to the browser. Treating only one layer rarely produces lasting results. The most effective speed optimization techniques address all three together.

Image optimization
Images are the single largest contributor to page weight on most sites. Compress images before upload using tools like Squoosh or ImageOptim. Serve modern formats like WebP or AVIF instead of JPEG or PNG. Use the srcset attribute so browsers load the right image size for each screen. Apply lazy loading so images below the fold only load when the user scrolls toward them.
Code and resource delivery
- Minify CSS, JavaScript, and HTML. Remove whitespace, comments, and unused code. Tools like Terser handle JavaScript; PostCSS handles CSS.
- Defer non-critical JavaScript. Scripts that do not affect the initial render should load after the page is visible. Use the
deferorasyncattribute on script tags. - Eliminate render-blocking resources. CSS and JavaScript that block the browser from painting the page delay LCP directly. Inline critical CSS and defer the rest.
- Reduce HTTP requests. Combine files where possible. Remove unused plugins and third-party scripts that add round trips without adding value.
- Enable browser caching. Set cache headers so returning visitors load assets from their local storage instead of your server.
Infrastructure improvements
A Content Delivery Network (CDN) stores copies of your site’s assets on servers around the world. A visitor in Chicago loads assets from a nearby node instead of a data center in another country. This alone can cut TTFB by hundreds of milliseconds. Pair a CDN with a fast hosting environment and HTTP/2 or HTTP/3 support for the biggest server-side gains.
Pro Tip: Before touching code, check your hosting plan. Shared hosting with resource limits is often the root cause of slow TTFB. Upgrading to a managed or dedicated environment can produce faster results than any front-end fix.
How do you measure, analyze, and validate speed improvements?
Measuring website performance is an iterative process, not a one-time audit. The correct sequence is: establish a baseline, identify the specific failing metric, implement one change at a time, and re-test to confirm the improvement. Changing multiple things at once makes it impossible to know what worked.
- Run a baseline audit. Use PageSpeed Insights to capture your current CrUX field data and Lighthouse lab scores. Record LCP, INP, CLS, and TTFB before touching anything.
- Identify the failing Core Web Vital. Focus on which metric fails rather than chasing an overall score. A site with a poor LCP needs different fixes than one with a high CLS.
- Analyze the request waterfall. The waterfall view in Chrome DevTools or a dedicated monitoring tool shows every resource the browser loads, in order. Tracing the critical path from navigation start to LCP reveals whether the delay comes from a slow server response, a render-blocking script, or a large hero image.
- Implement one fix at a time. Change a single variable, then re-test. This keeps your data clean and your diagnosis accurate.
- Validate with field data. Lab improvements show up immediately. Field data in CrUX updates over a 28-day rolling window. Wait for real-user data to confirm that your changes helped the majority of visitors, not just a controlled test.
Pro Tip: Request waterfall analysis often reveals that a slow LCP is caused by a render-blocking third-party script loading before the hero image. Removing or deferring that script can cut LCP by a full second without touching the image itself.
The iterative measurement process is what separates teams that see lasting gains from those that chase scores. Real optimization is a cycle, not a checklist.
Why does website speed matter for your business?
Site speed is a direct input to revenue. Visitors who wait too long abandon the page before it finishes loading, and that abandonment compounds across every traffic source you pay for.
“1-second load time sites convert at roughly 40%. Sites that take 5 seconds to load convert at roughly half that rate.” — Portent research via HubSpot
That gap is not theoretical. For an ecommerce store generating $500,000 per year, cutting load time from 5 seconds to 1 second could represent a meaningful share of additional revenue without acquiring a single new visitor. The role of site speed in ecommerce growth is well documented: faster sites keep shoppers engaged long enough to buy.
The business case for website performance optimization extends beyond conversions:
- SEO rankings. Google uses page experience signals, including Core Web Vitals, as ranking factors. A site that passes all three thresholds has a structural advantage over slower competitors in the same category.
- Bounce rate reduction. Faster pages hold attention. Visitors who see content quickly are more likely to click to a second page.
- Ad spend efficiency. Paid traffic sent to a slow landing page wastes budget. A faster page improves Quality Score in Google Ads, which lowers cost per click.
- Mobile experience. Mobile visitors on slower connections feel speed differences more acutely. Improving load time for mobile users expands your effective audience.
The benefits of site speed compound over time. A faster site ranks better, converts more visitors, and costs less to advertise against. Each improvement feeds the next.
Key Takeaways
Website speed optimization is the highest-leverage technical investment a site owner can make, because it simultaneously improves search rankings, conversion rates, and user engagement.
| Point | Details |
|---|---|
| Core Web Vitals set the standard | LCP ≤ 2.5s, INP ≤ 200ms, and CLS ≤ 0.1 are Google’s thresholds for a good experience. |
| Field data beats lab scores | CrUX measures real users at the 75th percentile, which is the data Google uses for rankings. |
| Optimize all three layers | Lasting speed gains require changes to server infrastructure, code delivery, and asset size together. |
| Measure iteratively | Establish a baseline, fix one variable, and re-test before moving to the next change. |
| Speed drives revenue | Sites loading in 1 second convert at roughly double the rate of sites loading in 5 seconds. |
Speed optimization is more than a score
I have reviewed hundreds of site audits over the years, and the most common mistake I see is treating PageSpeed Insights as a report card. Teams celebrate hitting a score of 90 and move on. Six months later, their field data still shows a failing LCP because the score was measured on a fast connection with no third-party scripts loaded.
The real work is in the request waterfall. When you trace every resource from navigation start to the moment the hero image appears, you find things no automated score will flag: a tag manager firing four analytics scripts before the main image loads, a font file blocking render for 400 milliseconds, a redirect chain adding two round trips before the first byte arrives. These are the fixes that move field data.
The other thing most articles skip is perceived performance. Objective load times and perceived smoothness are not the same thing. A site that loads in 2.8 seconds but shows a skeleton screen immediately feels faster than one that loads in 2.2 seconds but shows a blank white page for the first 1.5 seconds. Skeleton screens, progressive image loading, and instant feedback on button clicks all improve perceived speed without changing a single server setting.
My honest recommendation: treat speed optimization as an ongoing practice, not a project with an end date. Set a monthly review of your CrUX data. Watch for regressions after every new feature launch. The sites that maintain fast load times are the ones with a process, not just a one-time fix.
— Leon
How Swyftinteractive helps ecommerce brands build faster sites
Fast sites do not happen by accident. They are built with performance as a design constraint from the start, not bolted on after launch.
Swyftinteractive builds high-converting ecommerce websites with speed built into every layer, from hosting infrastructure to image delivery to code architecture. The team pairs that technical foundation with Klaviyo email automation and full-funnel growth strategy, so your site does not just load fast. It converts and retains. If you want a site that passes Core Web Vitals, ranks well, and drives measurable revenue, the ecommerce website checklist is a practical starting point. For brands ready to move faster, Swyftinteractive offers a direct consultation to audit your current performance and map out the highest-impact fixes.
FAQ
What is website speed optimization in simple terms?
Website speed optimization is the practice of making your site load faster and respond more quickly by improving server settings, code, and asset delivery. The goal is to reduce the time between a visitor clicking a link and seeing a fully usable page.
What are Core Web Vitals?
Core Web Vitals are Google’s three key performance metrics: LCP (loading speed), INP (interactivity), and CLS (visual stability). Google uses them as ranking signals, and good thresholds are LCP ≤ 2.5s, INP ≤ 200ms, and CLS ≤ 0.1.
How do I know if my website is slow?
Run your URL through PageSpeed Insights, which combines real-user CrUX data with Lighthouse lab diagnostics. Focus on which Core Web Vitals metrics fail rather than the overall score.
What affects website loading time the most?
The biggest factors are server response time (TTFB), uncompressed or oversized images, render-blocking JavaScript and CSS, and too many HTTP requests from third-party scripts. Fixing these four areas produces the largest measurable gains.
How long does it take to see improvements in search rankings after optimizing speed?
Core Web Vitals field data updates on a 28-day rolling window in CrUX. Ranking changes tied to page experience signals typically appear within four to eight weeks after your field data reflects the improvement.